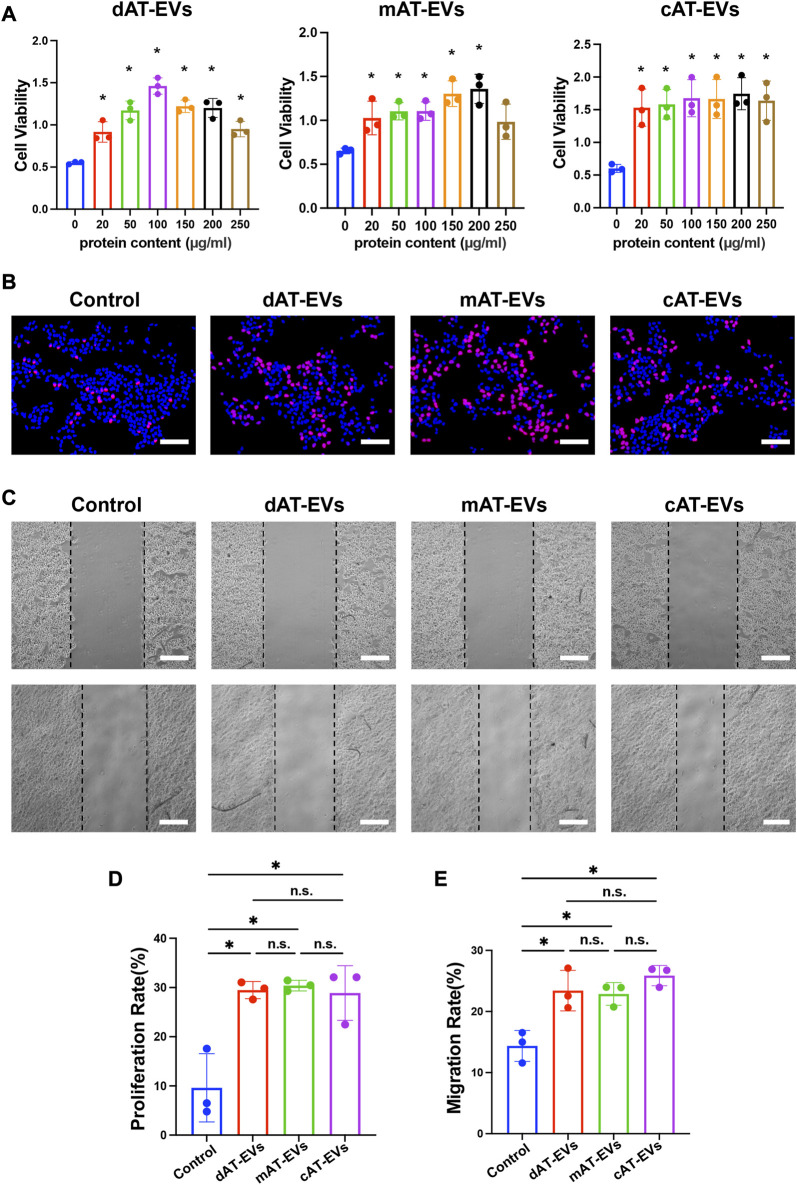
FIGURE 5.
AT-EVs promoted cell activity, proliferation, and migration of HaCaTs in vitro (A) Cell viability of HaCaTs incubated with different concentrations of AT-EVs for 72 h (n = 3). (B) Cell proliferation determined using the EdU assay; EdU-positive HaCaTs (red) and nuclei (blue) were observed by fluorescence microscopy; scale bar = 100 μm. (C) Migration of HaCaTs after incubation with 150 μg/mL AT-EVs 24 h (n = 3). Scale bar = 250 μm. (D) Statistical analysis of HaCaTs’ proliferation rate (n = 3). (E) Statistical analysis of HaCaTs’ migration rate (n = 3). n. s. no significant difference observed between groups. *p < 0.05.

