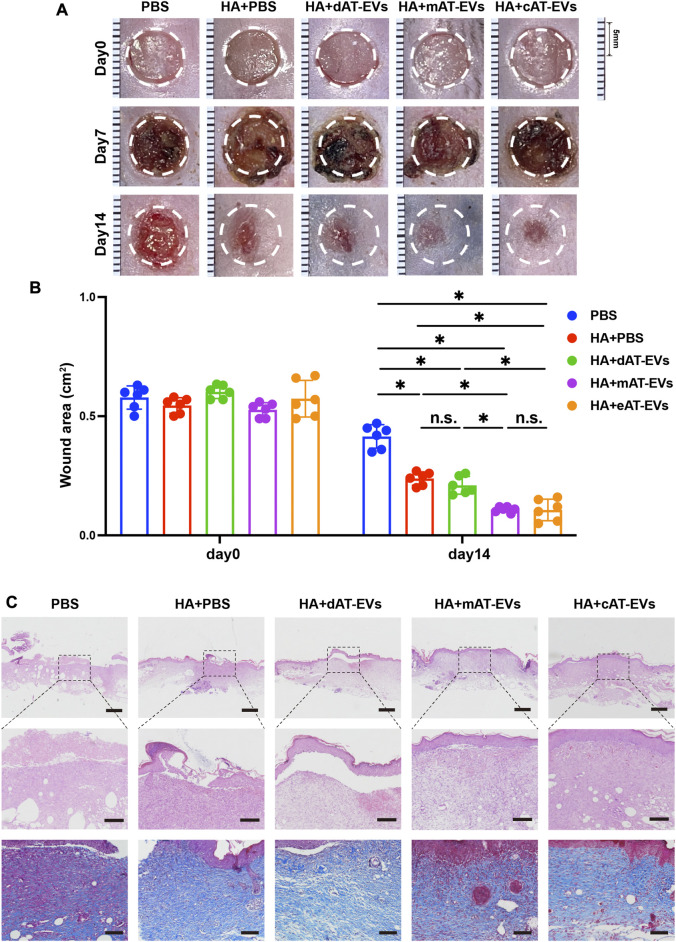
FIGURE 7.
AT-EVs promoted chronic wound healing in diabetic mice (A) Representative photographs of mouse wounds at days 0, 7, and 14. Scale bar = 1 mm. (B) Statistical analysis of the wound area (n = 6). (C) H&E and Masson staining of wound tissue sections, observed under a light microscope. Scale bar = 500 μm (top), 150 μm (middle), 100 μm (bottom).

