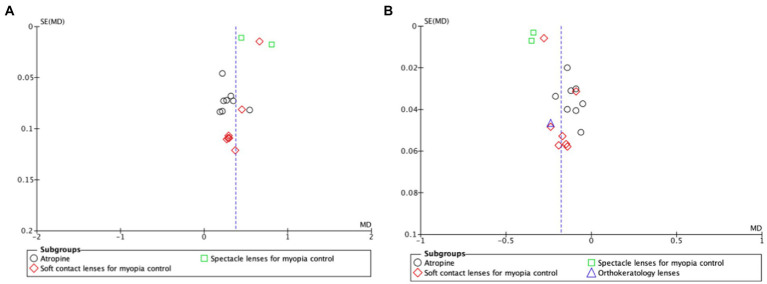
Figure 4.
Funnel plot of comparison for myopia progression (A) and axial length elongation (B). The funnel plot is a scatter plot that shows the effect estimates on the x-axis and measures of study precision (or study size) on the y-axis. The blue dotted vertical line represents the estimated common effect. SE, standard error; MD, mean difference.

