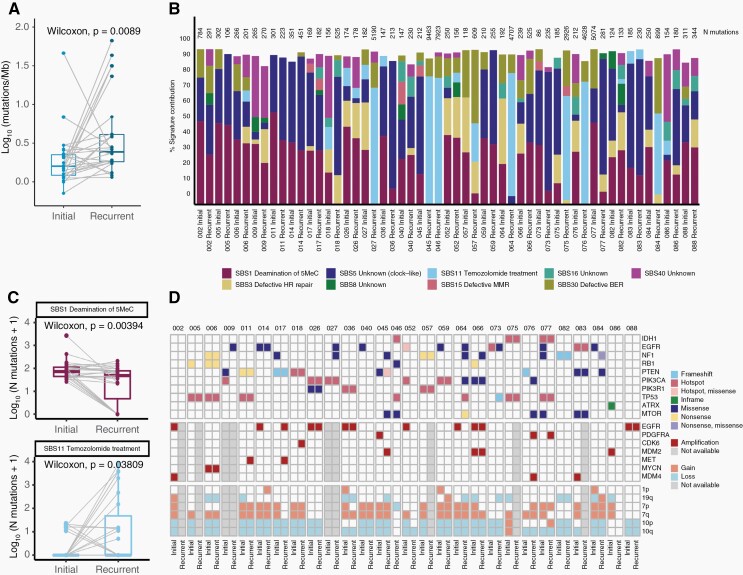
Figure 1.
Tumor mutational burden (TMB), mutational signature and landscape of tumors with late recurrence. (A) Log-transformed tumor mutational burden (TMB) calculated as the number of non-synonymous SNVs and INDELs per megabase. Lines indicate paired samples. Paired Wilcoxon test P-value is depicted on the box plot. (B) Contribution of selected COSMIC mutational signatures in each sample. Sample ID is indicated at the bottom of the barplot and total number of mutations (synonymous + non-synonymous) is indicated on top of the barplot (N mutations). Color indicate 9 different consensus COSMIC signatures. (C) Boxplots indicating the number of mutations contributing to the SBS1 (top) and SBS11 (bottom) signatures in the matched samples. Lines join the paired tumor samples from a given patient. Signatures with no significant change are shown in Supplementary Figure 3A. (D) Heatmap depicting mutations (SNVs&INDELs; top), amplifications (middle) and arm-level copy number gains/losses (bottom) in driver genes.

