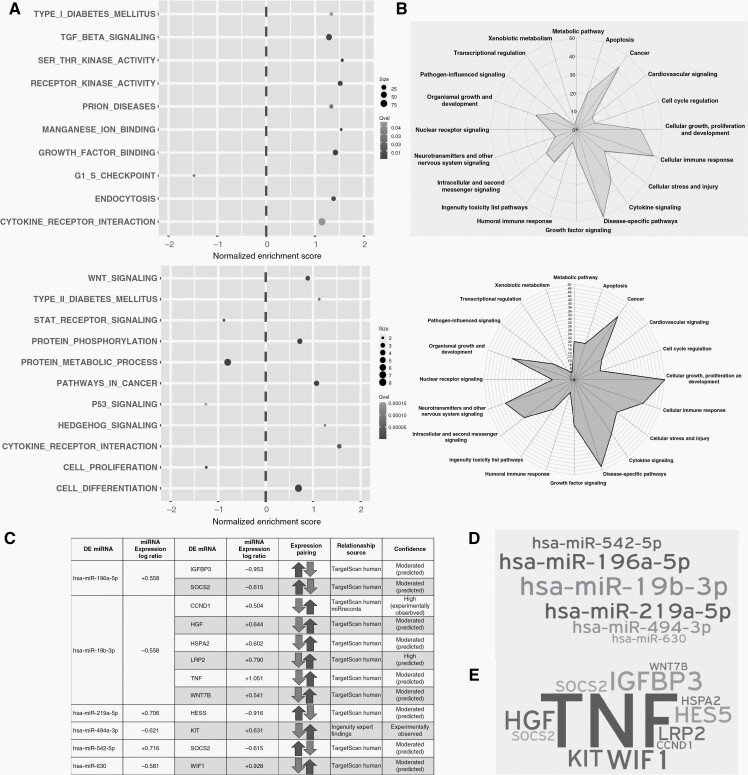
Figure 4.
Deregulated pathways upon late recurrence (A) Gene set enrichment analysis of the mRNA (upper panel) and miRNA (lower panel) datasets for GO, KEGG and Reactome pathways. X axis indicates the Normalized Enrichment Score (NES). Positive NES indicates upregulation and negative NES, downregulated on a given pathway in recurrence. Grayscale indicates level of adjusted significance (q value) and dot size is proportional to the number of contributed leading edge genes. (B) Radar graph scored based on pathway analysis using IPA for mRNA data (upper panel) and miRNA data (lower panel). (C) Integration of mRNA and miRNA dataset and its translation into united deregulated pathways. Differentially regulated miRNAs with their inversely regulated putative mRNA targets. (D) Word cloud of differentially regulated miRNAs engaged in binding to their theoretical mRNA targets. (E) Word cloud of affected putative mRNA targets. Size implies number of targets, and level of impact by miR deregulation on putative targets.

