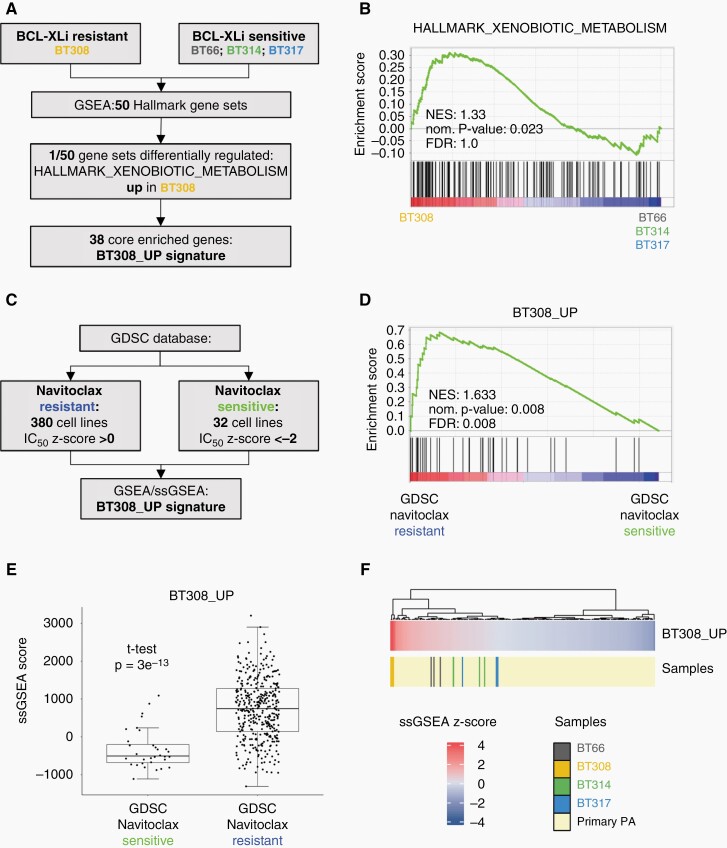
Fig. 5.
Identification of a gene signature differentiating the BCL-XLi resistant cell line DKFZ-BT308 from BCL-XLi sensitive cell lines. (A) Flowchart depicting the deduction of BT308_UP signature. (B) GSEA of the HALLMARK_XENOBIOTIC_METABOLISM gene set in BT308 vs. BCL-Xli sensitive PA cell lines. (C) Work-flow of BT308_UP signature validation in the independent GDSC2 dataset. (D) Comparison of BT308_UP signature expression in the GDSC group “navitoclax resistant” vs. the GDSC group “navitoclax sensitive”. (E) ssGSEA scores of BT308_UP signature in the two GDSC groups “navitoclax resistant” and “navitoclax sensitive”. (F) BT308_UP signature ssGSEA z-scores in the four PA cell lines in OIS mode (n = 3 samples per cell line) and in primary PA (ps_mkheidel_mkdkfz209_u133p2). GSEA: geneset enrichment analysis; ssGSEA: single sample GSEA; NES: normalized enrichment score; norm.: normalized; FDR: false discovery rate.

