Fig. 3.
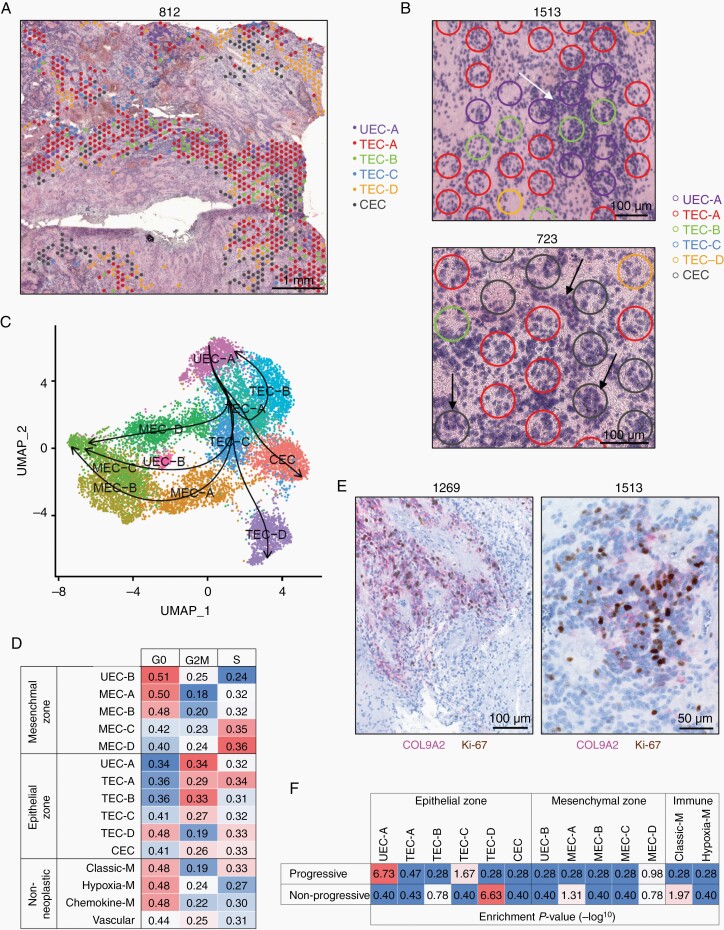
PFA epithelial zones are comprised of progenitor-like and ependyma-differentiated cells. (A) Representative section showing spatial distribution of PFA epithelial zone subclusters. (B) Representative sections indicating colocalization of UEC-A, TEC and CEC subclusters with PFA histological features (white arrow = hypercellularity; true ependymal rosettes and epithelial differentiation = black arrow). (C) Pseudotime trajectories of PFA neoplastic cells with directionality designated by setting UEC-A as the starting cluster. (D) Cell cycle phase fractions in PFA neoplastic and non-neoplastic subclusters. (E) Representative dual IHC staining showing colocalization of UEC-A marker COL9A2 and mitosis marker Ki-67 in PFA. (F) Association of ST spot clusters with progression in PFA patients. Bulk-tumor gene expression profiles from 40 PFA at initial presentation were categorized into those that were either non-progressive (n = 13) or progressive (n = 27) at 5 years follow-up. Differentially expressed genes between progressive and non-progressive (P < .05) were subjected to enrichment analysis for ST spot cluster markers (top 50). Values shown are hypergeometric analysis marker geneset enrichment P-values (−log10). CEC, ciliated EPN cells; TEC, transportive EPN cells; UEC, undifferentiated EPN cells; MEC, mesenchymal EPN cells.

