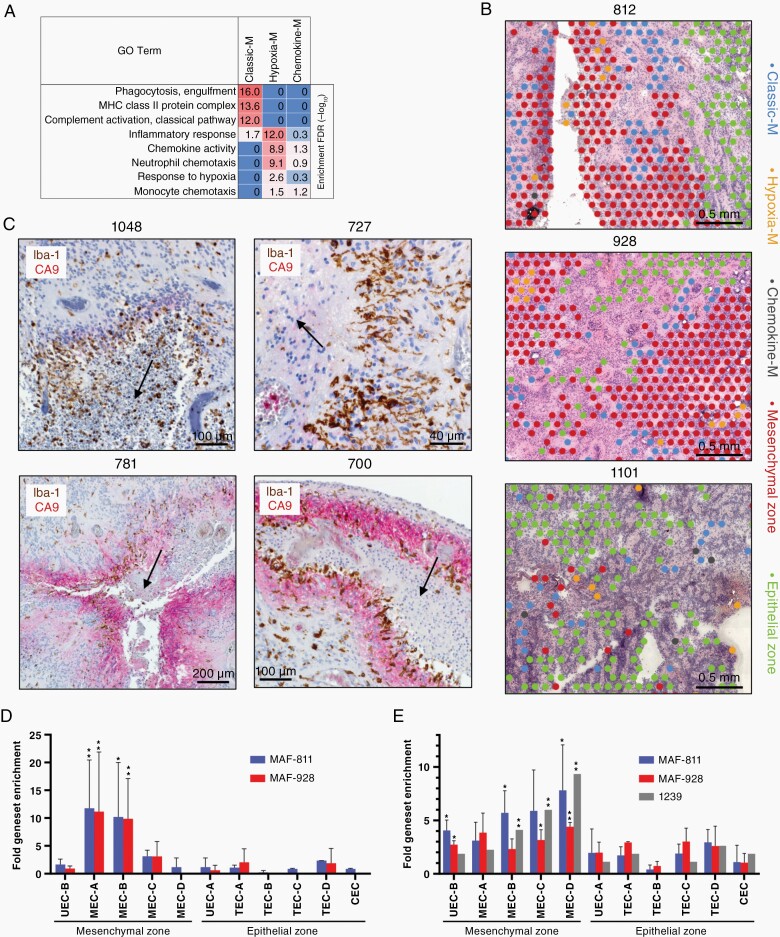
Fig. 5.
Myeloid lineage immune cells are spatially related to and interact with specific mesenchymal ST clusters in PFA. (A) Top GO term geneset enrichments for myeloid clusters [hypergeometric test FDR (−log10)]. (B) Representative spatial arrangement of myeloid clusters with respect to mesenchymal and epithelial zone clusters in three PFA samples. (C) Dual IHC for markers of myeloid cells (Iba-1; brown) and MEC zones (CA9; red) in representative PFA samples showing arrangement relative to areas of early necrosis (indicated by arrows). Top panels depict typical perinecrotic myeloid accumulation in the absence of CA9, lower left shows perinecrotic intermixing of myeloid with CA9+ mesenchymal cells, and lower right depicts sequential perinecrotic bands of myeloid accumulation and CA9+ mesenchymal cells. (D) Upregulation of specific ST cluster marker genesets in PFA cell lines MAF-811 (n = 2 experiments) and MAF-928 (n = 2) after exposure to CD14+ myeloid. After a 3 day coculture RNA was harvested and sequenced (RNAseq) to identify upregulated genes (FPKM fold change > 1.5) compared to untreated cell lines. Upregulated genes for each experiment were then compared to mesenchymal and epithelial zone ST spot cluster marker genesets (top 50) by hypergeometric analysis (*highest P-value within all cell line replicates < .005, **P < .0005). (E) Specific upregulation of ST cluster specific genes in PFA cell lines [MAF-811 (n = 3) and MAF-928 (n = 2)] and a short term PFA culture [1239 (n = 1)] after propagation in 2% hypoxia for 3 days was obtained from a previous study (Ref1) and analyzed as above. CEC, ciliated EPN cells; TEC, transportive EPN cells; UEC, undifferentiated EPN cells; MEC, mesenchymal EPN cells.

