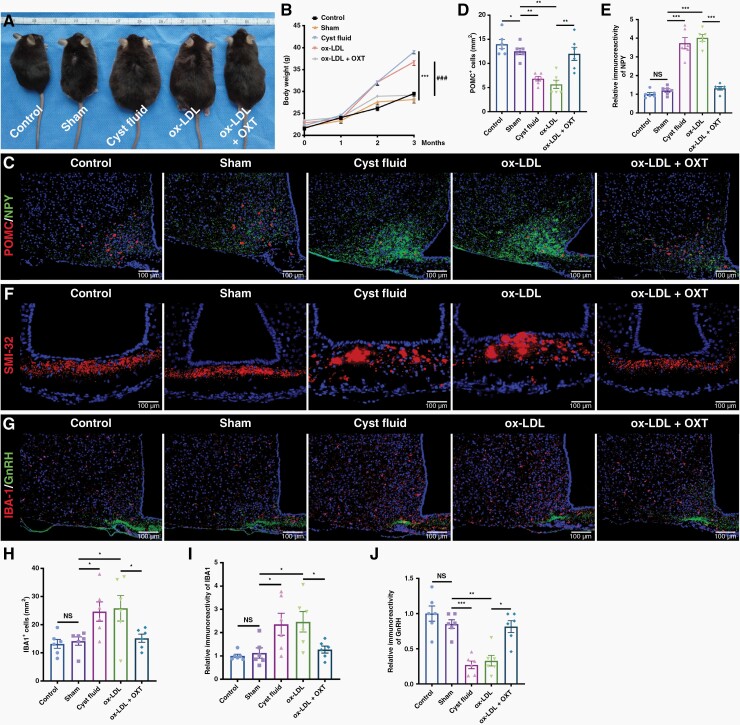
Figure 4.
OXT blocks ox-LDL-induced hypothalamic dysfunction in mice. (A) Representative images of control mouse, sham surgery mouse, and mouse treated with cystic fluid, ox-LDL, and ox-LDL + OXT 3 months after the LV localization injection. (B) Body weight of the mice treated as described in (A) and measured at 0, 1, 2, and 3 months after the LV localization injection. (C) Double immunofluorescence staining of the ARC of mice treated with cystic fluid or ox-LDL ± OXT. Representative images of POMC and NPY staining. (D) Quantification of the POMC+ cells described in (C) (n = 6/group). (E) Quantification of the NPY fluorescence intensity in the ARC of mice described in (C) (n = 6/group). (F) Immunofluorescence staining of the ME of mice treated with cystic fluid or ox-LDL ± OXT. Representative images of SMI-32 staining. (G) Double immunofluorescence staining of the ME of mice treated with cystic fluid or ox-LDL ± OXT. Representative images of IBA-1 and GnRH staining. (H) Quantification of the IBA-1+ microglia described in (G) (n = 6/group). (I and J) Quantification of the fluorescence intensity of IBA-1 (I) and GnRH (J) in the ME of mice described in (G) (n = 6/group). Data are presented as the mean ± SEM. *P < .05, **P < .01, ***P < .001, ###P < .001, NS, not significant. Statistical analysis: (B, D, E, and H–J) one-way ANOVA followed by Fisher’s LSD post hoc multiple comparison test.

