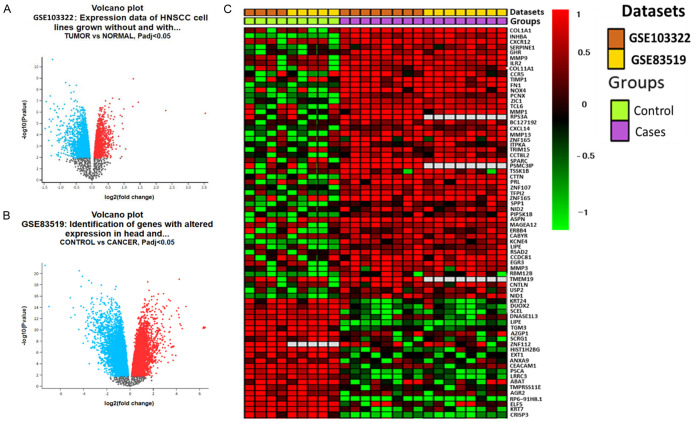
Figure 1.
Differentially-expressed genes (DEGs) in head and neck extracted from GSE103322 and GSE83519 microarray datasets. A, B. Volcano plots of DEGs from the two datasets with red and blue dots represent upregulated and downregulated genes (P < 0.05). C. The heatmap of overexpressed overlapping genes.

