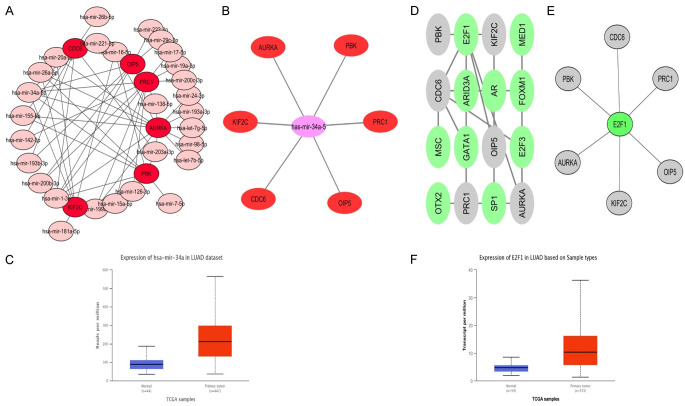
Figure 10.
TF-miRNA-mRNA network analysis of real hub genes in LUAD. (A) miRNAs targeting real hub genes, (B) has-mir-34a-5p miRNA targeting real hub genes, (C) relative expression of has-mir-34a-5p in LUAD and normal controls, (D) TFS targeting real hub genes, (E) E2F1 targeting real hub genes, and (F) relative expression analysis of E2F1 in LUAD samples paired with controls. The pink and grey nodes represent the miRNA, red nodes represent the hub gene, while green node represent the TFS.

