. 2023 Feb 1;5(2):e220165. doi: 10.1148/ryai.220165

Figure 2:

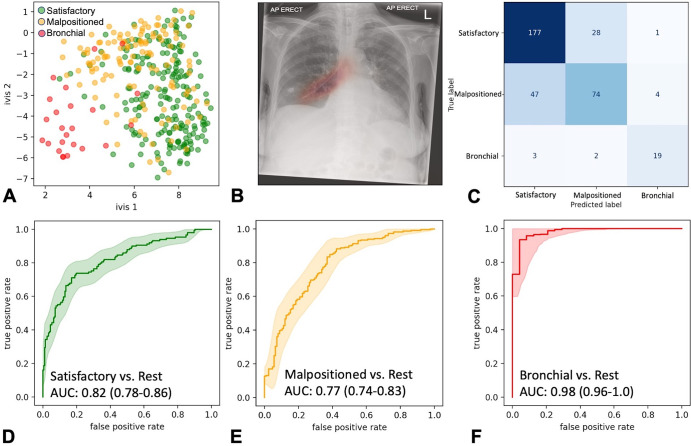
Ensemble performance for nasogastric tube (NGT) malposition detection on the testing set (355 images). (A) Scatterplot shows two-dimensional twin neural network (Ivis) embedding of the combined global average pooling layer values in the NGT malposition ensemble. Each point represents a single chest radiograph in the testing set. Green, orange, and red points reflect satisfactory, malpositioned, and bronchial NGT ground truth values, respectively. (B) Heatmap shows gradient-weighted class activation mapping activation of the final convolutional layer in the 1024 × 1024 InceptionV3 model superimposed over a bronchial-positioned NGT. (C) Ensemble confusion matrix between ground truths and predicted image labels. Predicted labels reflect the class with the greatest classification probability. (D–F) Receiver operating characteristic curves for each class of interest. Shaded areas are 95% CIs, generated using 2000 bootstrapped samples. AP = anteroposterior, AUC = area under the receiver operating characteristic curve.

Ensemble performance for nasogastric tube (NGT) malposition detection on the testing set (355 images). (A) Scatterplot shows two-dimensional twin neural network (Ivis) embedding of the combined global average pooling layer values in the NGT malposition ensemble. Each point represents a single chest radiograph in the testing set. Green, orange, and red points reflect satisfactory, malpositioned, and bronchial NGT ground truth values, respectively. (B) Heatmap shows gradient-weighted class activation mapping activation of the final convolutional layer in the 1024 × 1024 InceptionV3 model superimposed over a bronchial-positioned NGT. (C) Ensemble confusion matrix between ground truths and predicted image labels. Predicted labels reflect the class with the greatest classification probability. (D–F) Receiver operating characteristic curves for each class of interest. Shaded areas are 95% CIs, generated using 2000 bootstrapped samples. AP = anteroposterior, AUC = area under the receiver operating characteristic curve.