. 2023 Feb 1;5(2):e220165. doi: 10.1148/ryai.220165

Figure 3:

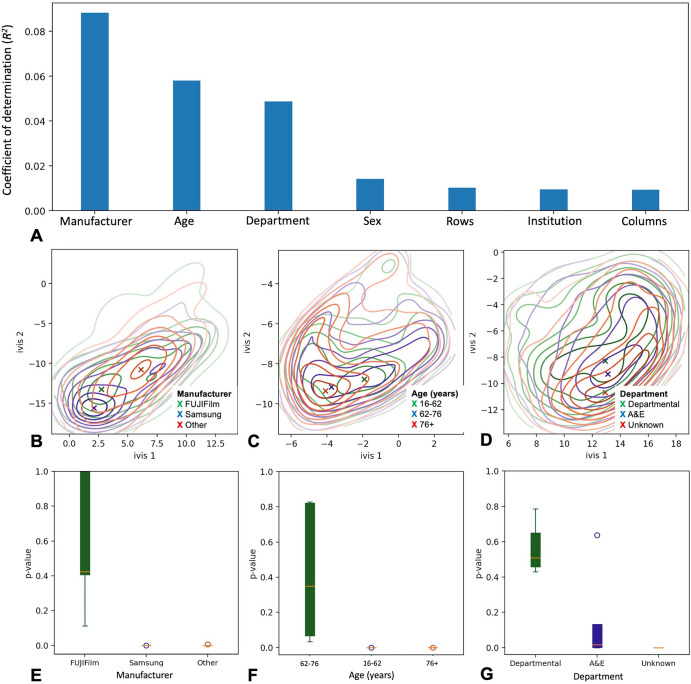
Captured model features and concept drift detection. (A) Bar chart shows Digital Imaging and Communications in Medicine (DICOM) tags and their respective R2 values. Values reflect variance within the global average pooling layer explained by each DICOM tag. (B–D) Contour plots represent two-dimensional embedding of global average pooling layer values in the testing set. Colors correspond to individual confounder values, and density centroids are shown as an X. (E–G) Box and whisker plots of two-sample Kolmogorov-Smirnov test P values show likelihood of concept drift in a testing set of interest. Green boxes are testing set samples with the same inclusion criteria as the training set, and blue and red boxes are testing set samples with known concept drift (red boxes very small due to tight P values). The box extends from the lower to upper quartile values of the data, with a line at the median. The whiskers extend from the box to show the range of the data, bounded by the fifth and 95th data percentile. Points represent values past the end of the whiskers. A&E = accidents & emergency.

Captured model features and concept drift detection. (A) Bar chart shows Digital Imaging and Communications in Medicine (DICOM) tags and their respective R2 values. Values reflect variance within the global average pooling layer explained by each DICOM tag. (B–D) Contour plots represent two-dimensional embedding of global average pooling layer values in the testing set. Colors correspond to individual confounder values, and density centroids are shown as an X. (E–G) Box and whisker plots of two-sample Kolmogorov-Smirnov test P values show likelihood of concept drift in a testing set of interest. Green boxes are testing set samples with the same inclusion criteria as the training set, and blue and red boxes are testing set samples with known concept drift (red boxes very small due to tight P values). The box extends from the lower to upper quartile values of the data, with a line at the median. The whiskers extend from the box to show the range of the data, bounded by the fifth and 95th data percentile. Points represent values past the end of the whiskers. A&E = accidents & emergency.