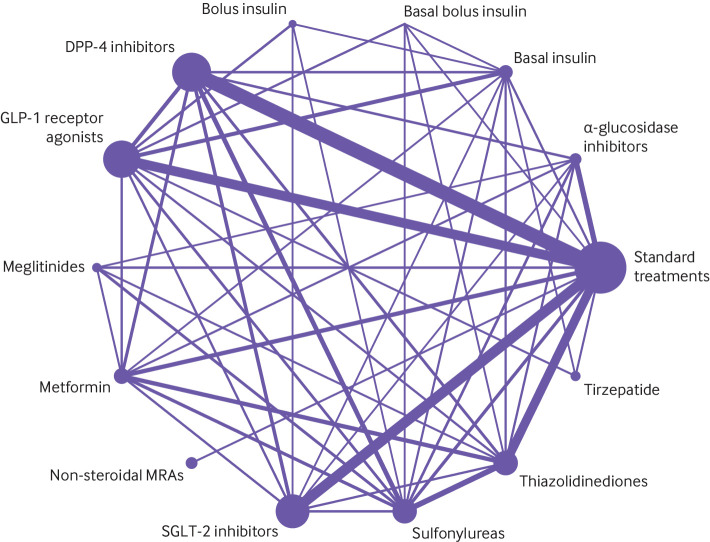
Fig 2.
Network plot for all included studies, by drug treatments. Drug treatments were grouped by their drug classes. Network plots consist of the drug nodes with node size being proportional to the sample size and the comparison edges with line thickness being proportional to the number of trials. MRA=non-steroidal mineralocorticoid receptor antagonists; GLP-1=glucagon-like peptide-1; SGLT-2=sodium glucose cotransporter-2; DPP-4=dipeptidyl peptidase-4

