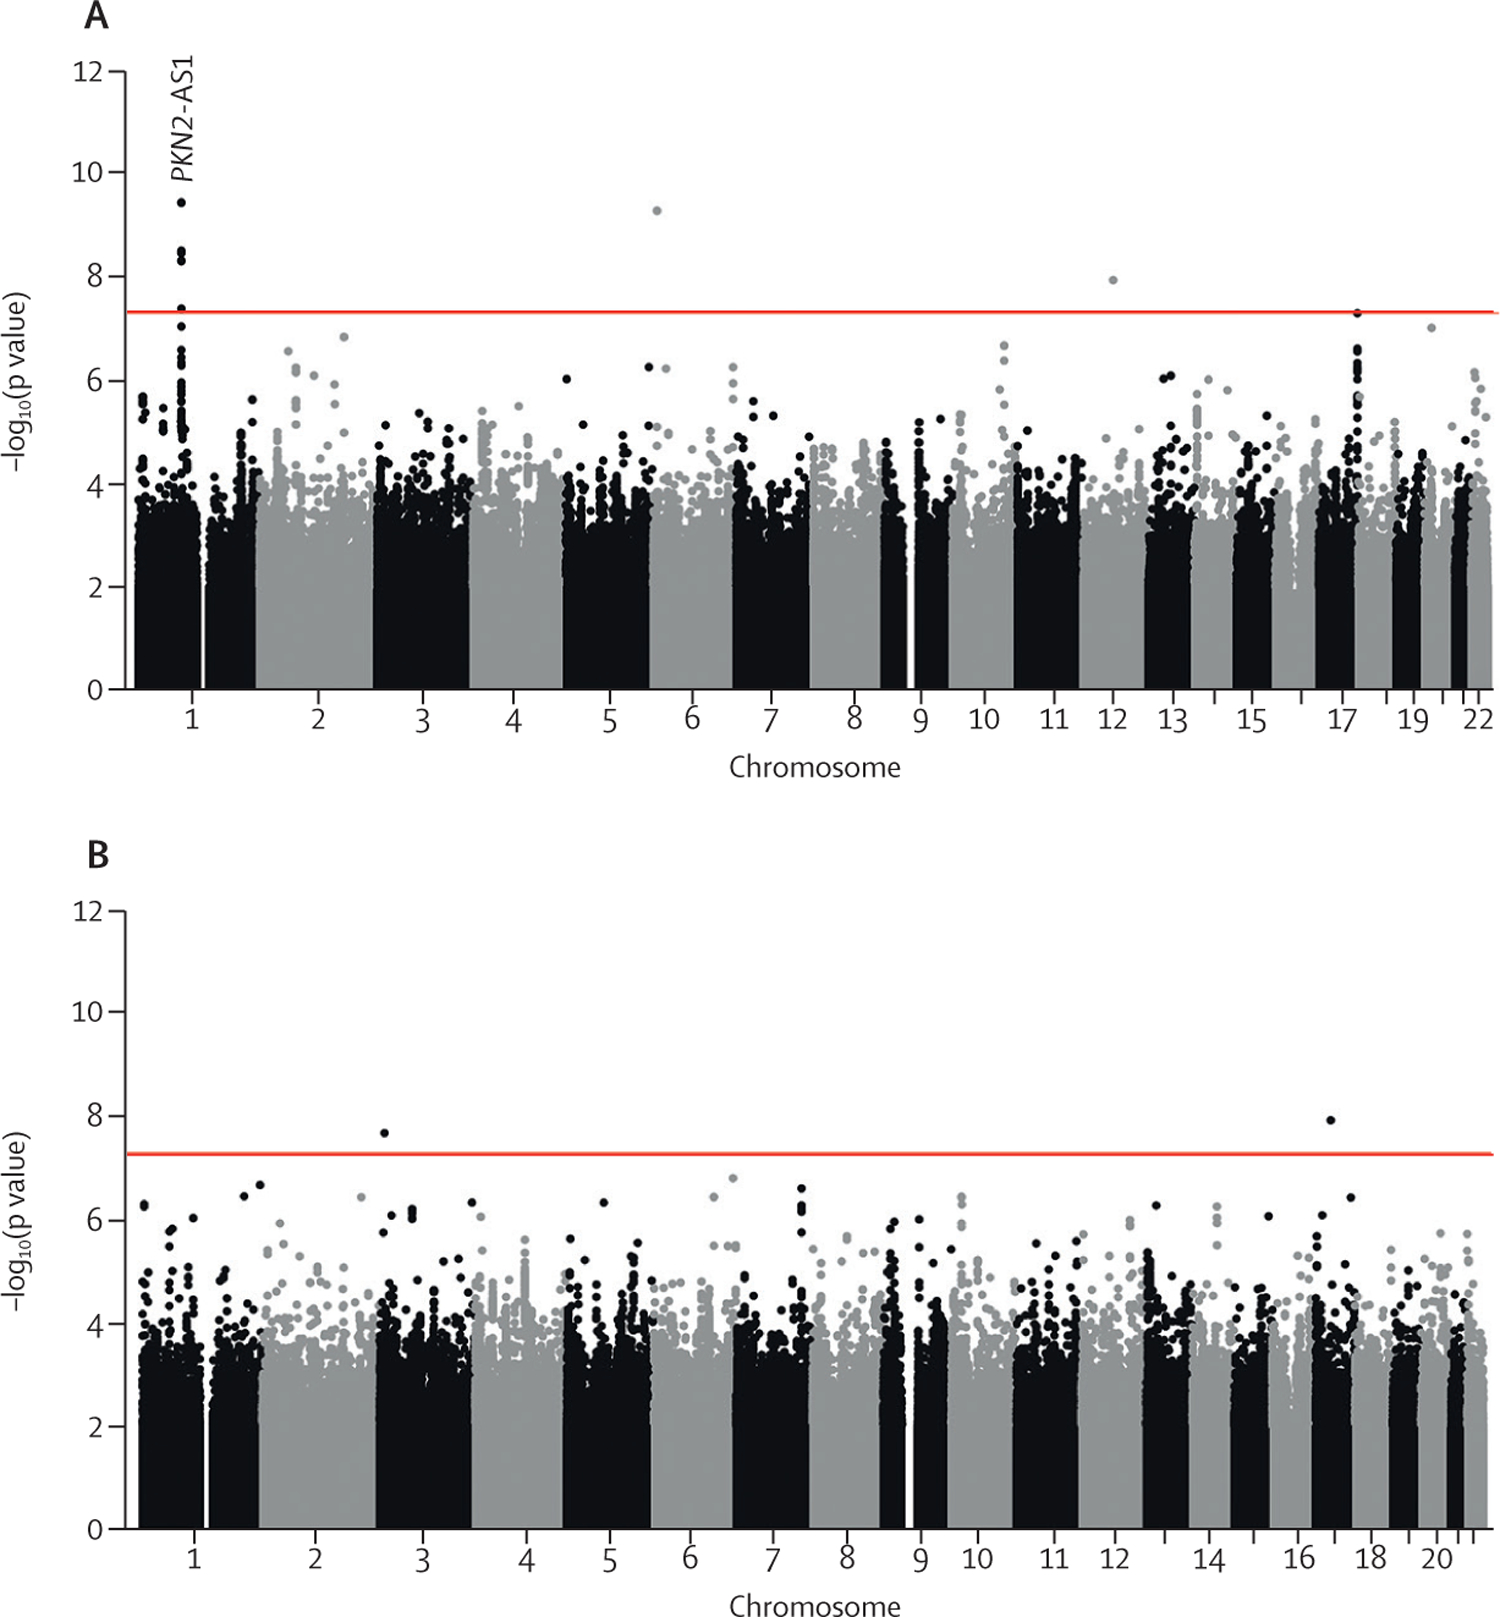
Figure 1: Manhattan plots for longitudinal FVC (A) and DLCO (B) genome-wide meta-analyses.

Each point represents a variant, with chromosomal position on the x axis and –log10(p value) on the y axis. The red horizontal line shows the genome-wide significance threshold of p=5 × 10⁻⁸. DLCO=diffusing capacity of the lung for carbon monoxide. FVC=forced vital capacity. PKN2-AS1=protein kinase N2 gene in introns of the antisense RNA.
