
Figure 3: Region plot for the locus significantly associated with FVC decline.
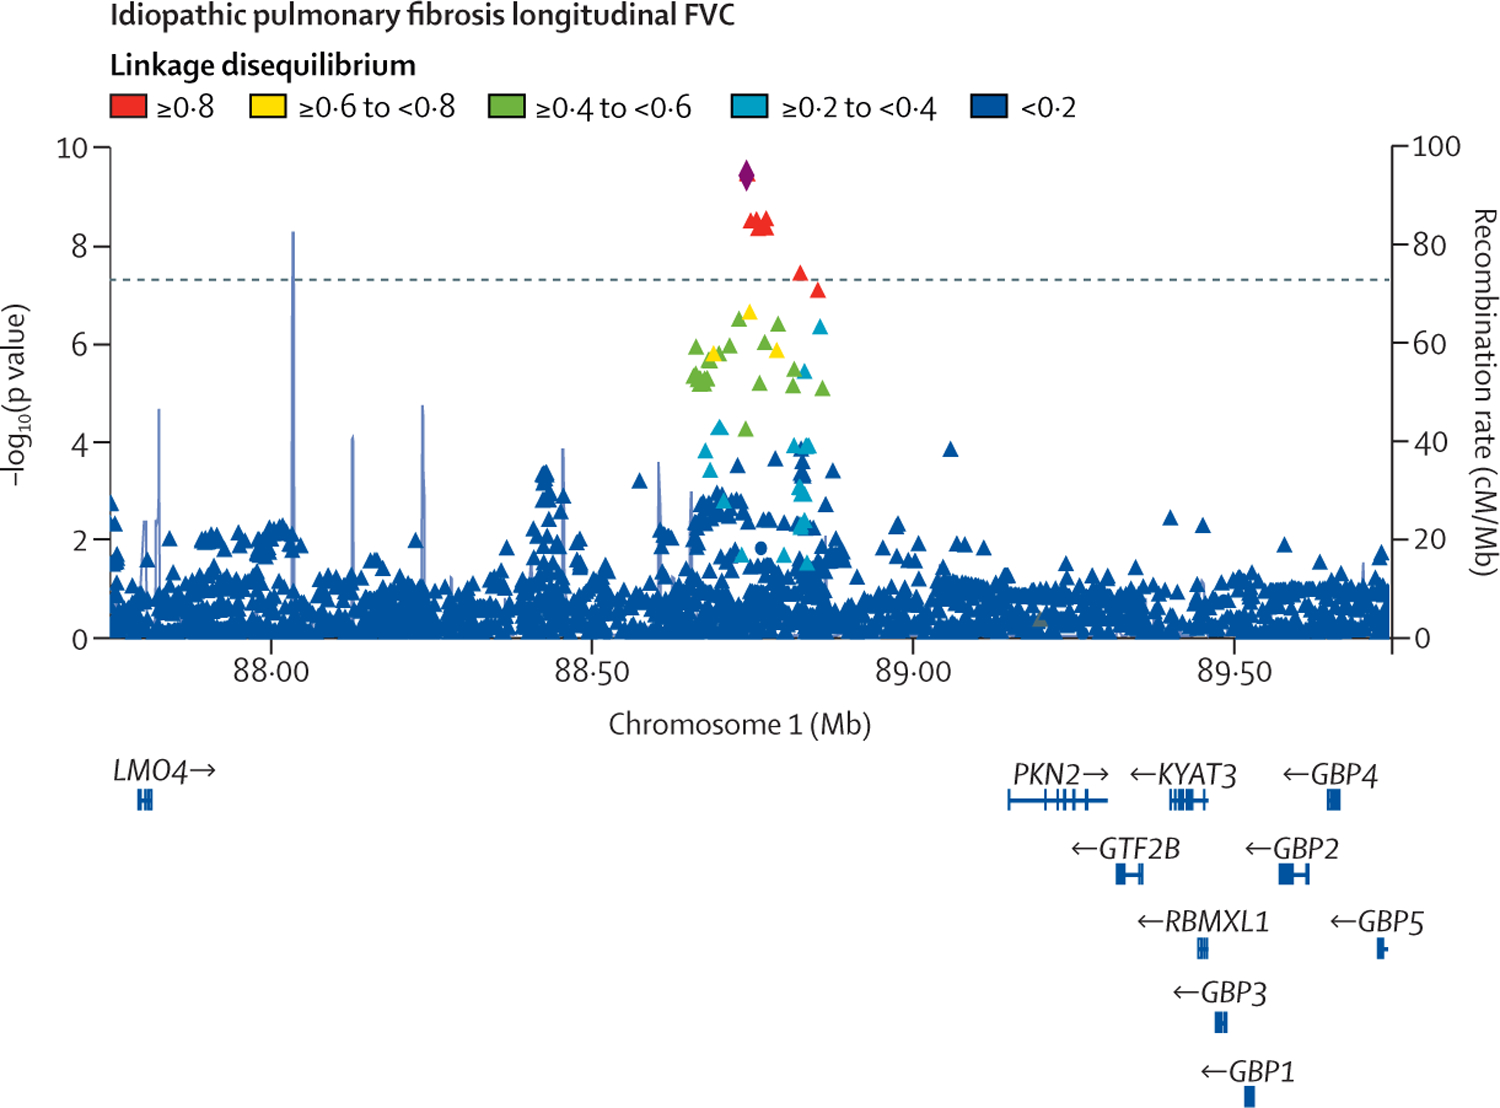
Each point represents a variant, with chromosomal position on the x axis and −log10(p value) on the y axis.
The dashed horizontal line shows the genome-wide significance threshold of p=5 × 10⁻⁸. Variants are coloured by linkage disequilibrium with the sentinel variant (rs115982800) depicted as a diamond. Light blue lines show the recombination rate and gene positions are shown below the x axis. The plot was created using LocusZoom.31 FVC=forced vital capacity.