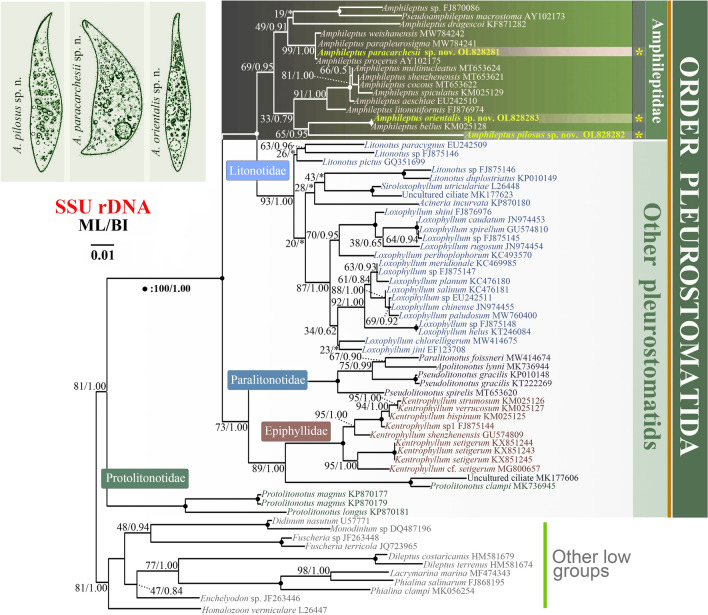
Fig. 10.
Phylogenetic tree based on SSU rDNA sequences, showing the systematic positions of A. paracarchesii sp. nov., A. pilosus sp. nov., and A. orientalis sp. nov. Bootstrap values for maximum likelihood (ML) and posterior probabilities for Bayesian inference (BI) were mapped onto the best-scoring ML tree. The scale bar denotes one substitution per one hundred nucleotide positions

