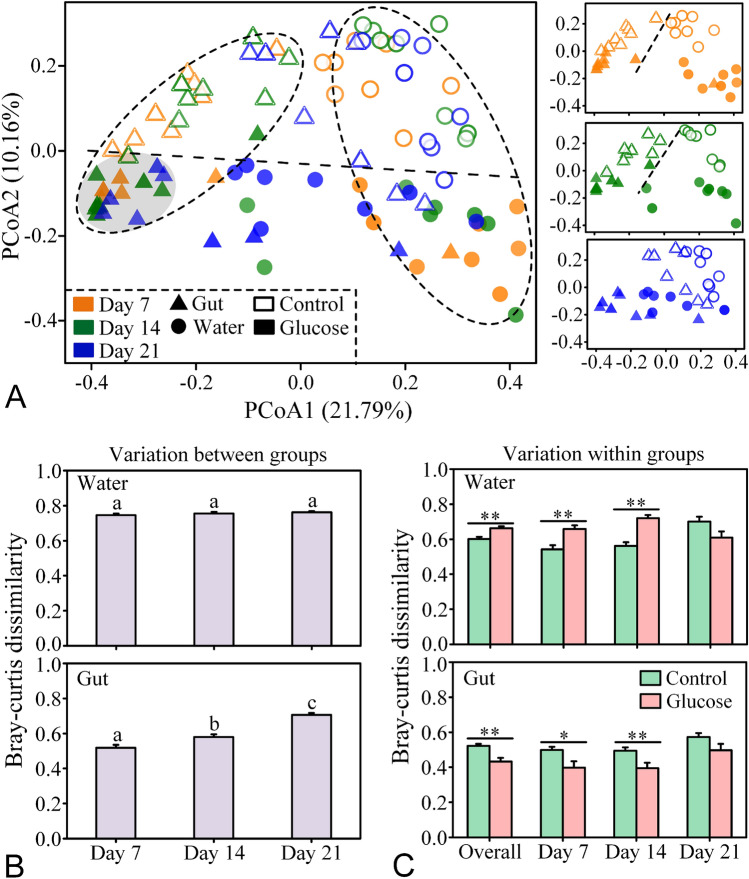
Fig. 2.
A Principal Coordinate Analysis (PCoA) plot based on the Bray–Curtis dissimilarity show the dissimilarities of bacterial community between the control and glucose groups in the water and gut samples. Original (Day 0) samples are deviated far from the samples at other time points, so they are not shown in the figure. The gray shadow indicates that the intestinal bacterial communities of the glucose group are very similar. B Bray–Curtis dissimilarity analysis reveal the dissimilarities of parallel samples between the two groups in rearing water and shrimp guts. Different lowercase letters on the histogram indicate a significant difference (one-way ANOVA, P < 0.05). C Bray–Curtis dissimilarity analysis reveal the similarities of parallel samples within the control or glucose addition groups. The statistical significance of the differences between the two groups are tested using an Independent t-test (*P < 0.05, **P < 0.01)

