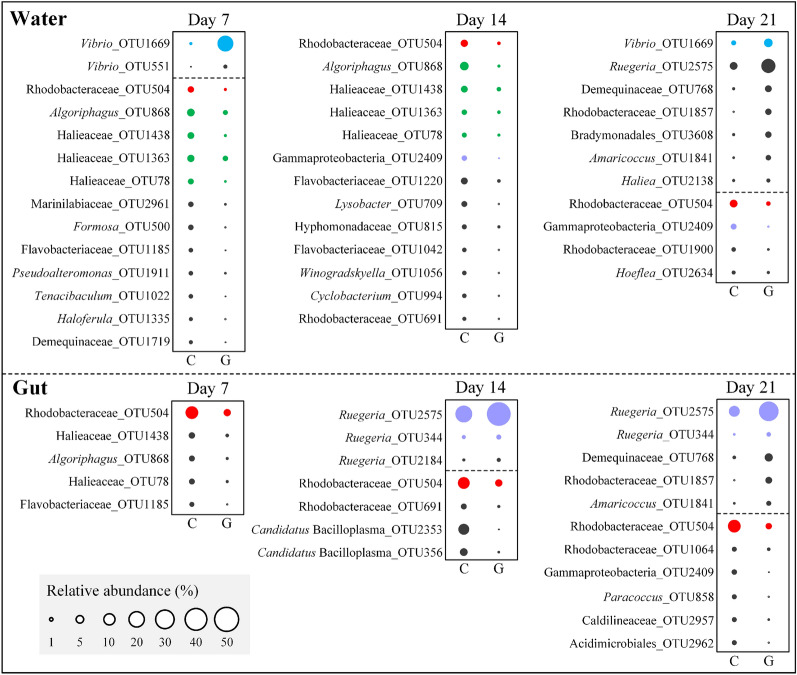
Fig. 4.
Bubble plots show the abundant OTUs (average relative abundance > 1%) with significant differences (Independent t-test, P < 0.05) between the control and glucose groups in the rearing water and shrimp guts at each sampling day. Red bubbles indicates that they appear at all sampling points; Green, blue and purple bubbles indicates that they appeared at Days 7 and 14, Days 7 and 21, and Days 14 and 21, respectively. The relative abundances of OTUs were square root transformed and showed with the size of bubbles

