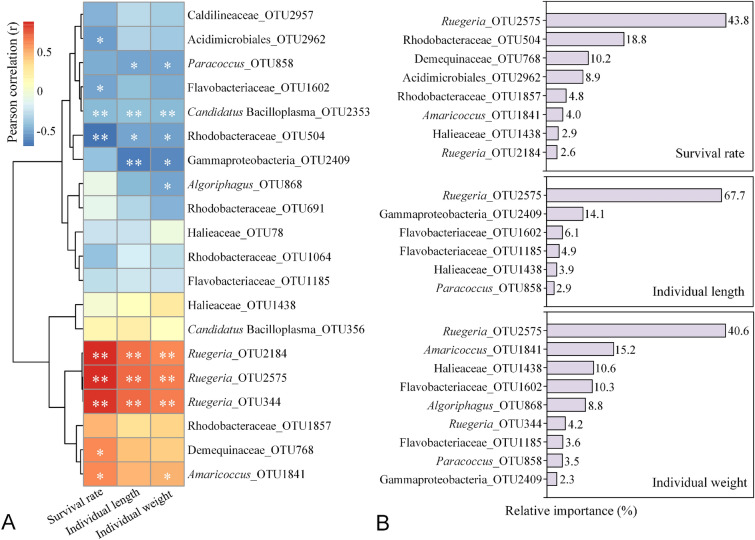
Fig. 5.
Heatmaps illustrate the relationship (Pearson’ correlation) between the discriminatory OTUs of the shrimp guts (from Fig. 4) and shrimp growth parameters at Day 21. * and ** represent statistical significance at P < 0.05 and P < 0.01 levels, respectively. The relative importance of these discriminatory OTUs in the shrimp guts on shrimp growth parameters in the BRT model. OTUs with relative importance greater than 2% are displayed in the figure

