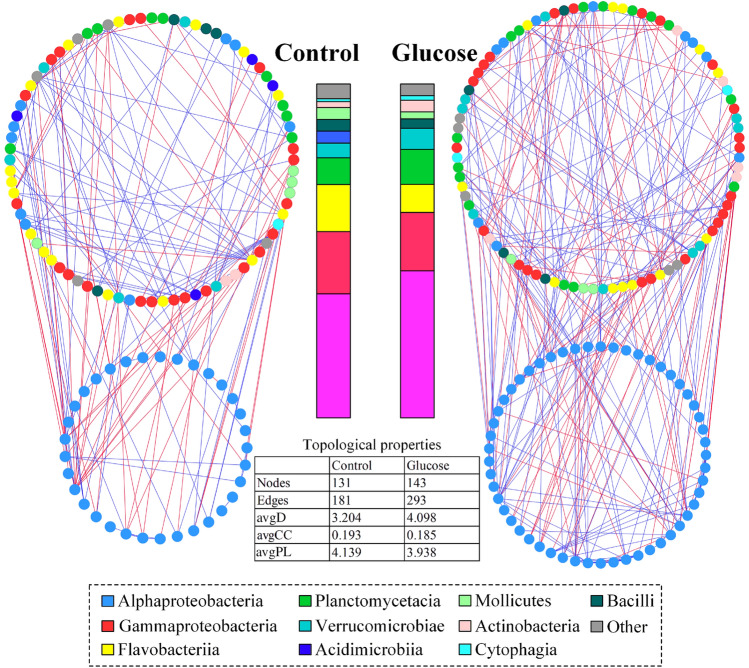
Fig. 6.
Networks and related topological properties of the control and glucose groups in shrimp guts. The color of the node shows different dominant classes, and the relative abundances of these classes are showed in the bar charts. The color of the edge shows positive (green) or negative (red) correlations between nodes. Rhodobacteraceae (blue circles) is separately grouped in each network. avgD average degree, avgCC average clustering coefficient, avgPL average path length

