
Figure 6.
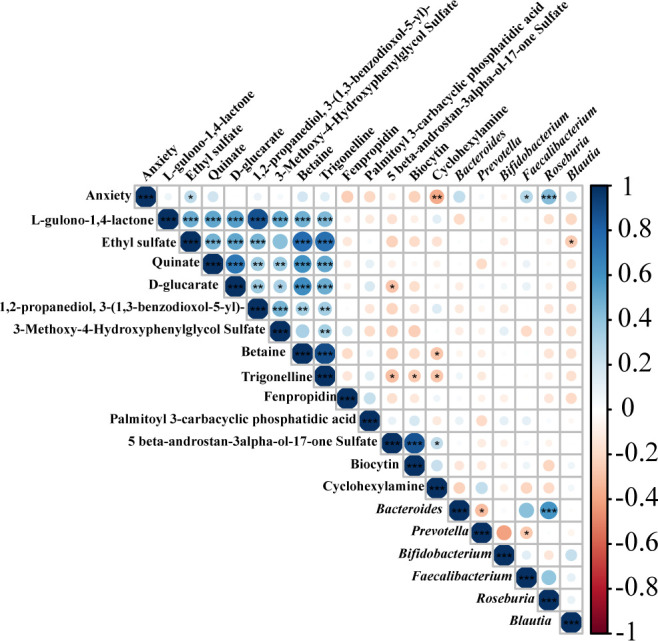
Spearman correlation analysis among anxiety-behavior, gut microbiota, and fecal metabolites. Spearman’s rank correlation coefficient among anxiety symptom scores, 13 metabolites in Table 2 and top 6 relative abundance of gut microbiota. P values are depicted in red and blue, where red refers to a negative correlation and blue refers to a positive correlation. ∗p < 0.05, ∗∗p < 0.01, ∗∗∗p < 0.001.