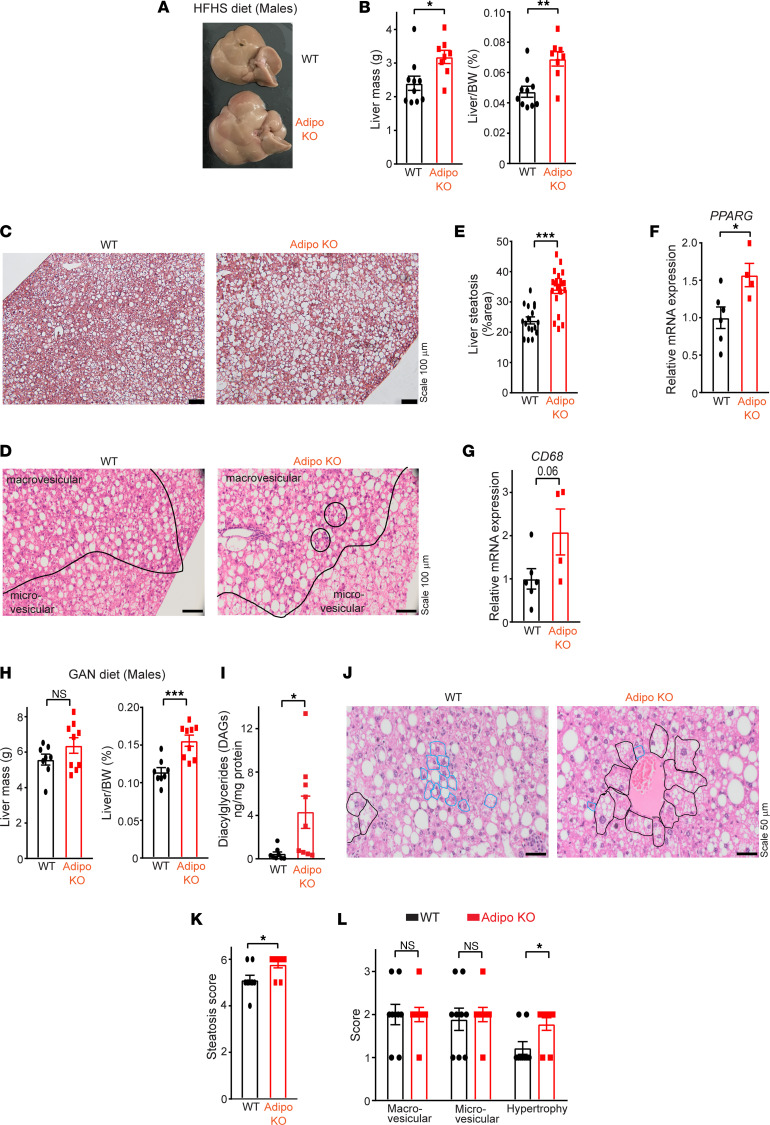
Figure 3. Adipose SWELL1 deletion predisposes to developing NAFLD with overnutrition.
(A) Representative images of liver dissected from WT (top) and Adipo-KO (bottom) mice (males) fed with HFHS diet for 27 weeks. (B) Total liver mass and ratio of liver mass over body weight of WT and Adipo-KO mice from A. (C) Representative images of H&E-stained liver sections of WT and Adipo-KO mice (Scale bar: 100 μm). (D) Micro- and macrovesicular fat regions along with the mononuclear inflammatory cells (solid black circles) in WT and Adipo-KO mice (20× objective, 200× magnification). (E) Liver steatosis (%area) estimated from H&E-stained liver sections in C of WT (n = 2, 17 ROIs) and Adipo-KO (n = 2, 21 ROIs) mice using ImageJ software (NIH). (F) mRNA expression of PPARG in WT (n = 6) and Adipo-KO (n = 4) livers relative to control GAPDH. (G) mRNA expression of CD68 in WT (n = 6) and Adipo-KO (n = 4) livers relative to control GAPDH. (H) Total liver mass and ratio of liver mass over body weight of WT (n = 8) and Adipo-KO (n = 9) mice (males) fed with GAN diet for 23–25 weeks. (I) Measurement for total diacylglycerides (DAGs) from WT (n = 8) and Adipo-KO (n = 9) livers in H. (J) Representative images of H&E-stained liver sections of GAN diet–fed WT and Adipo-KO mice in H indicating cells that are normal (blue) and with hepatocellular hypertrophy (black outline) (40× objective). (K and L) Cumulative steatosis score (K) derived from macrovesicular, microvesicular, and hepatocellular hypertrophy scores (L) of liver sections from GAN diet–fed WT and Adipo-KO (n = 9 each) mice. Data are represented as mean ± SEM. Two-tailed unpaired t test was used in B, E–I, K, and L where *, **, and *** represent P < 0.05, P < 0.01, and P < 0.001, respectively. ROIs, regions of interest.

