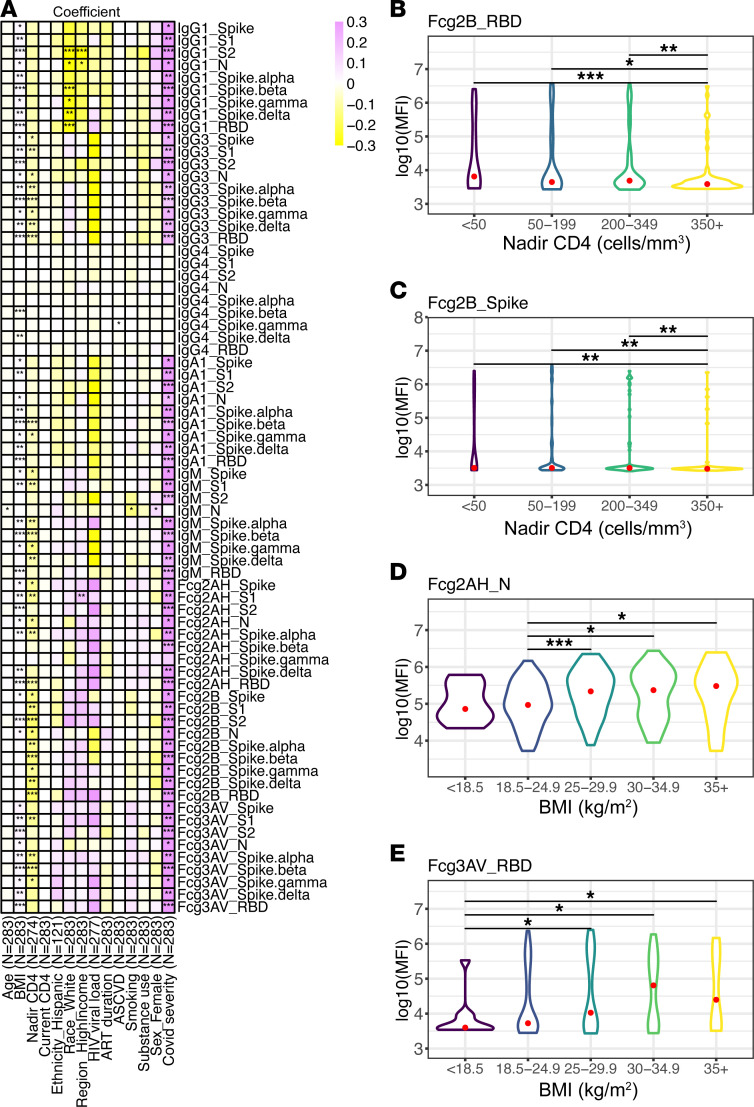
Figure 2. Univariate associations among COVID-19+ participants.
(A) Univariate heatmap relating COVID-19 severity and host factors to SARS-CoV-2–specific antibody isotype and subclass and Fc-receptor binding. Coefficients derived from unadjusted linear regression modeling. (B and C) Violin plots of RBD-specific FcγRIIB (B) and Spike-specific FcγRIIB (C) across nadir CD4 groups are shown. (D and E) Violin plots of N-specific FcγRIIA (D) and RBD-specific FcγRIIIA (E) across BMI groups. Significance testing was performed via Wilcoxon rank-sum test and is shown as *P < 0.05, **P < 0.01, or ***P < 0.001.

