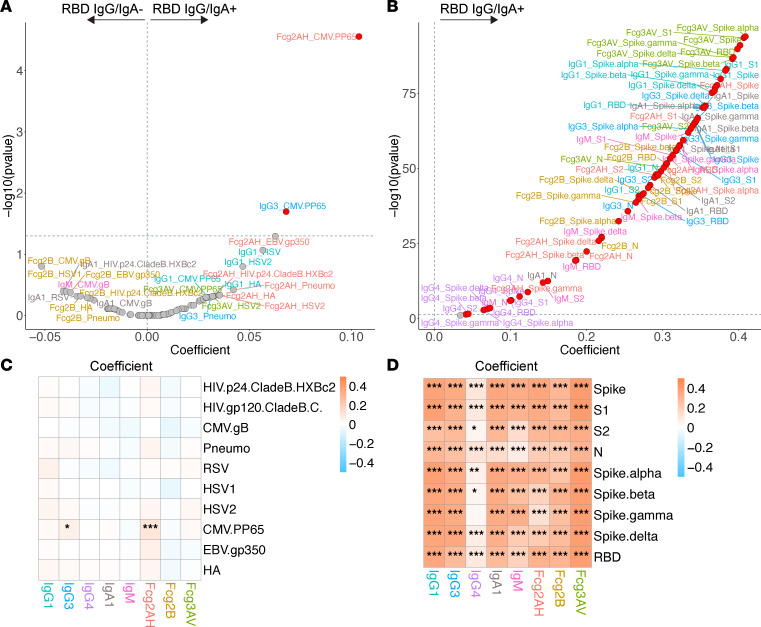
Figure 3. Volcano plots and heatmaps of effect of SARS-CoV-2 RBD IgG/IgA positivity on the humoral immune repertoire among all participants.
(A and B) Volcano plots of effect of SARS-CoV-2 RBD IgG/IgA positivity on the non–SARS-CoV-2 humoral repertoire (A) and SARS-CoV-2 humoral repertoire (B) among all participants. Volcano plots constructed from linear regression models, adjusted for age, sex, GBD region, nadir CD4, and HIV viral load, with horizontal dashed line of significance displayed for FDR-corrected P = 0.05. Responses higher in the antibody-positive fall toward the right of the vertical dashed line, while responses higher in the antibody-negative fall toward the left of the vertical dashed line. (C and D) Respective heatmaps of the volcano plot coefficients for the non–SARS-CoV-2 (C) and SARS-CoV-2 (D) humoral responses. Coefficients > 0 reflect higher antibody responses in the antibody-positive participants, while coefficients < 0 reflect higher antibody responses in the antibody-negative participants. Significance in the heatmaps is shown as FDR-corrected *P < 0.05, **P < 0.01, or ***P < 0.001. Specific antibody isotype, subclass, and Fc-receptor responses are color-coded between the volcano plots and heatmaps.

