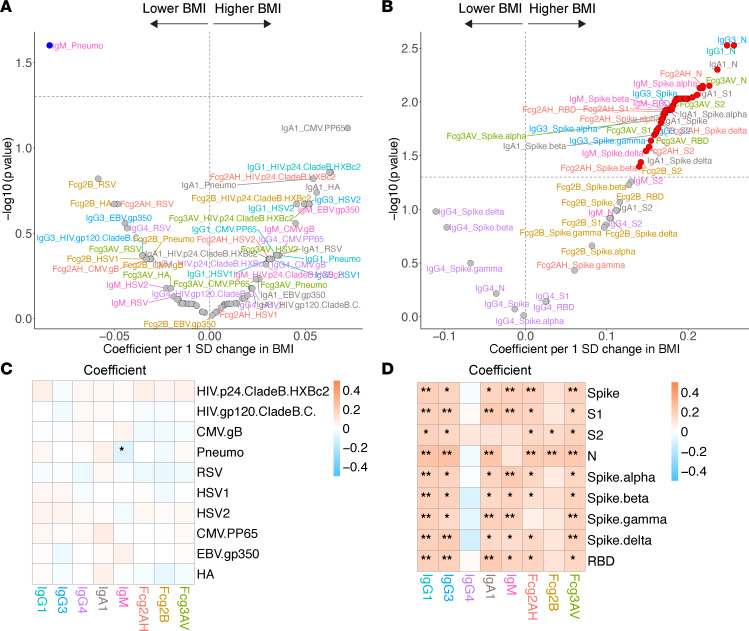
Figure 7. Volcano plots and heatmaps of effect of BMI on the humoral immune repertoire.
(A and B) Adjusted volcano plots of effect of BMI on the non–SARS-CoV-2 humoral repertoire (A) among the COVID-19– cohort and SARS-CoV-2 humoral repertoire (B) among COVID-19+ cohort. Coefficients reflect the effect of a 1 SD increase in BMI, which was Z scored for each participant. (C and D) Respective heatmaps of the volcano plot coefficients for the non–SARS-CoV-2 (C) and SARS-CoV-2 (D) humoral responses. Significance in the heatmaps is shown as FDR-corrected *P < 0.05 or **P < 0.01.

