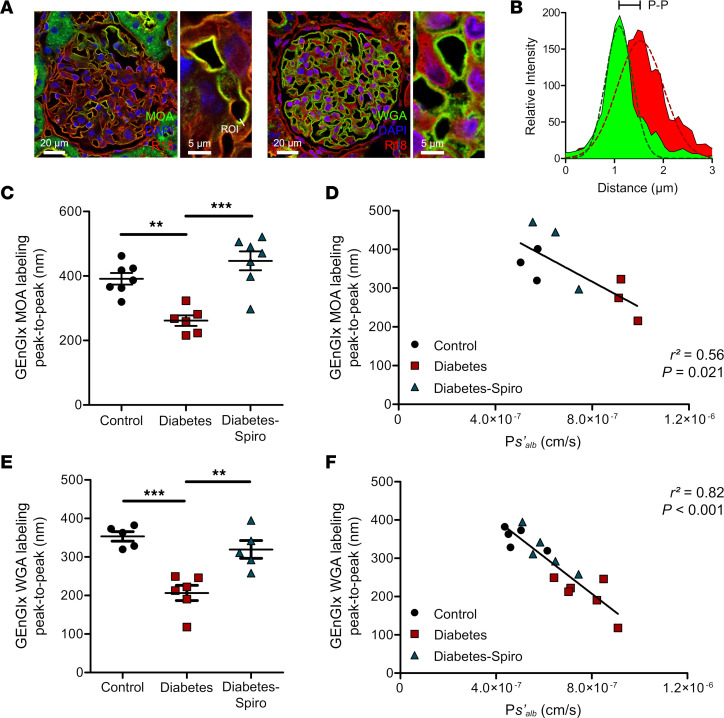
Figure 2. Fluorescence profile peak-to-peak measurements confirm that glomerular endothelial glycocalyx damage is prevented by MR antagonism and correlates strongly with glomerular albumin permeability.
Rats were perfused with Ringer solution, and the left kidney was removed for lectin staining. (A) Representative images show glomerular capillaries labeled red (R18) and the luminal glomerular endothelial glycocalyx (GEnGlx) labeled green with Marasmium oreades agglutinin (MOA) or wheat germ agglutinin (WGA). Scale bars: 20 μm and 5 μm. ROI, region of interest for fluorescence profile peak-to-peak (P-P)measurement. (B) Representative relative intensity peaks of R18 (red) and MOA (green) profiles showing P-P assessment of the GEnGlx; Gaussian curves (dashed lines) were fit to the raw intensity data of each plot for P-P measurements. (C and D) Quantification at week 8 after STZ of GEnGlx MOA labeling P-P (control, n = 7; diabetes, n = 6; diabetes-spironolactone [diabetes-spiro], n = 7) and functional association with the rate of glomerular albumin leakage (Ps’alb) (n = 9). (E and F) Quantification at week 8 after STZ of GEnGlx WGA labeling P-P (control, n = 5; diabetes, n = 6; diabetes-spiro, n = 5) and functional association with the rate of glomerular Ps’alb (n = 16). In C and E, 1-way ANOVA was used for statistical analysis, followed by Tukey’s multiple comparisons. Each dot, triangle, and square on the graph represents a rat. Data are expressed as mean ± SEM. **P < 0.01; ***P < 0.001.

