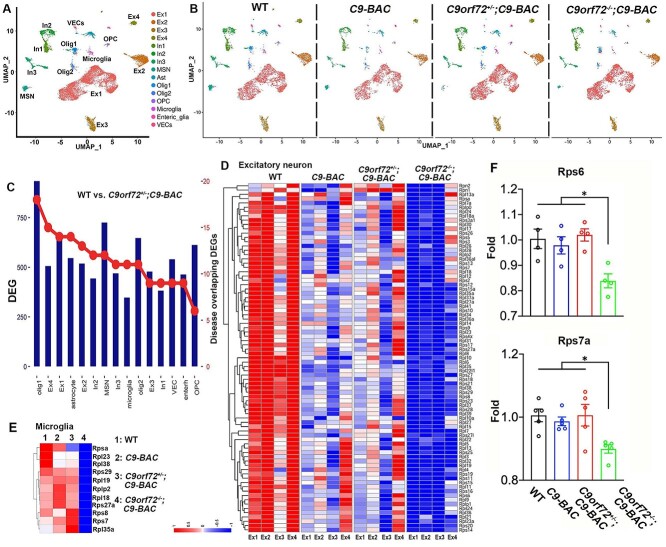
Figure 3.
Single nucleus RNA-sequencing (snRNA-seq) analysis reveals transcriptional downregulation of ribosomal protein (RP) genes in mutant mice. (A, B) UMAP visualization reveals 15 clusters in the frontal cortex from 10-month-old WT (5093), C9-BAC (3210), C9orf72+/−;C9-BAC (5090) and C9orf72−/−;C9-BAC (4582) mice. (C) Differentiated expressed genes (DEGs) in individual cell clusters between WT and C9orf72+/−;C9-BAC mice. The right axis indicates the numbers of DEGs that overlap with neurodegenerative disease-related genes, which are obtained from the Neurodegenerative Disease Variation Database (NDDVD). (D, E) Heatmap illustrating RP gene expression changes in WT, C9-BAC, C9orf72+/−;C9-BAC and C9orf72−/−;C9-BAC mice within individual excitatory neurons (D) and microglia (E). (F) RT-PCR analysis of Rps6 and Rps7a mRNA expression in frontal cortex. Z-score value is used for visualization in snRNA-seq data.

