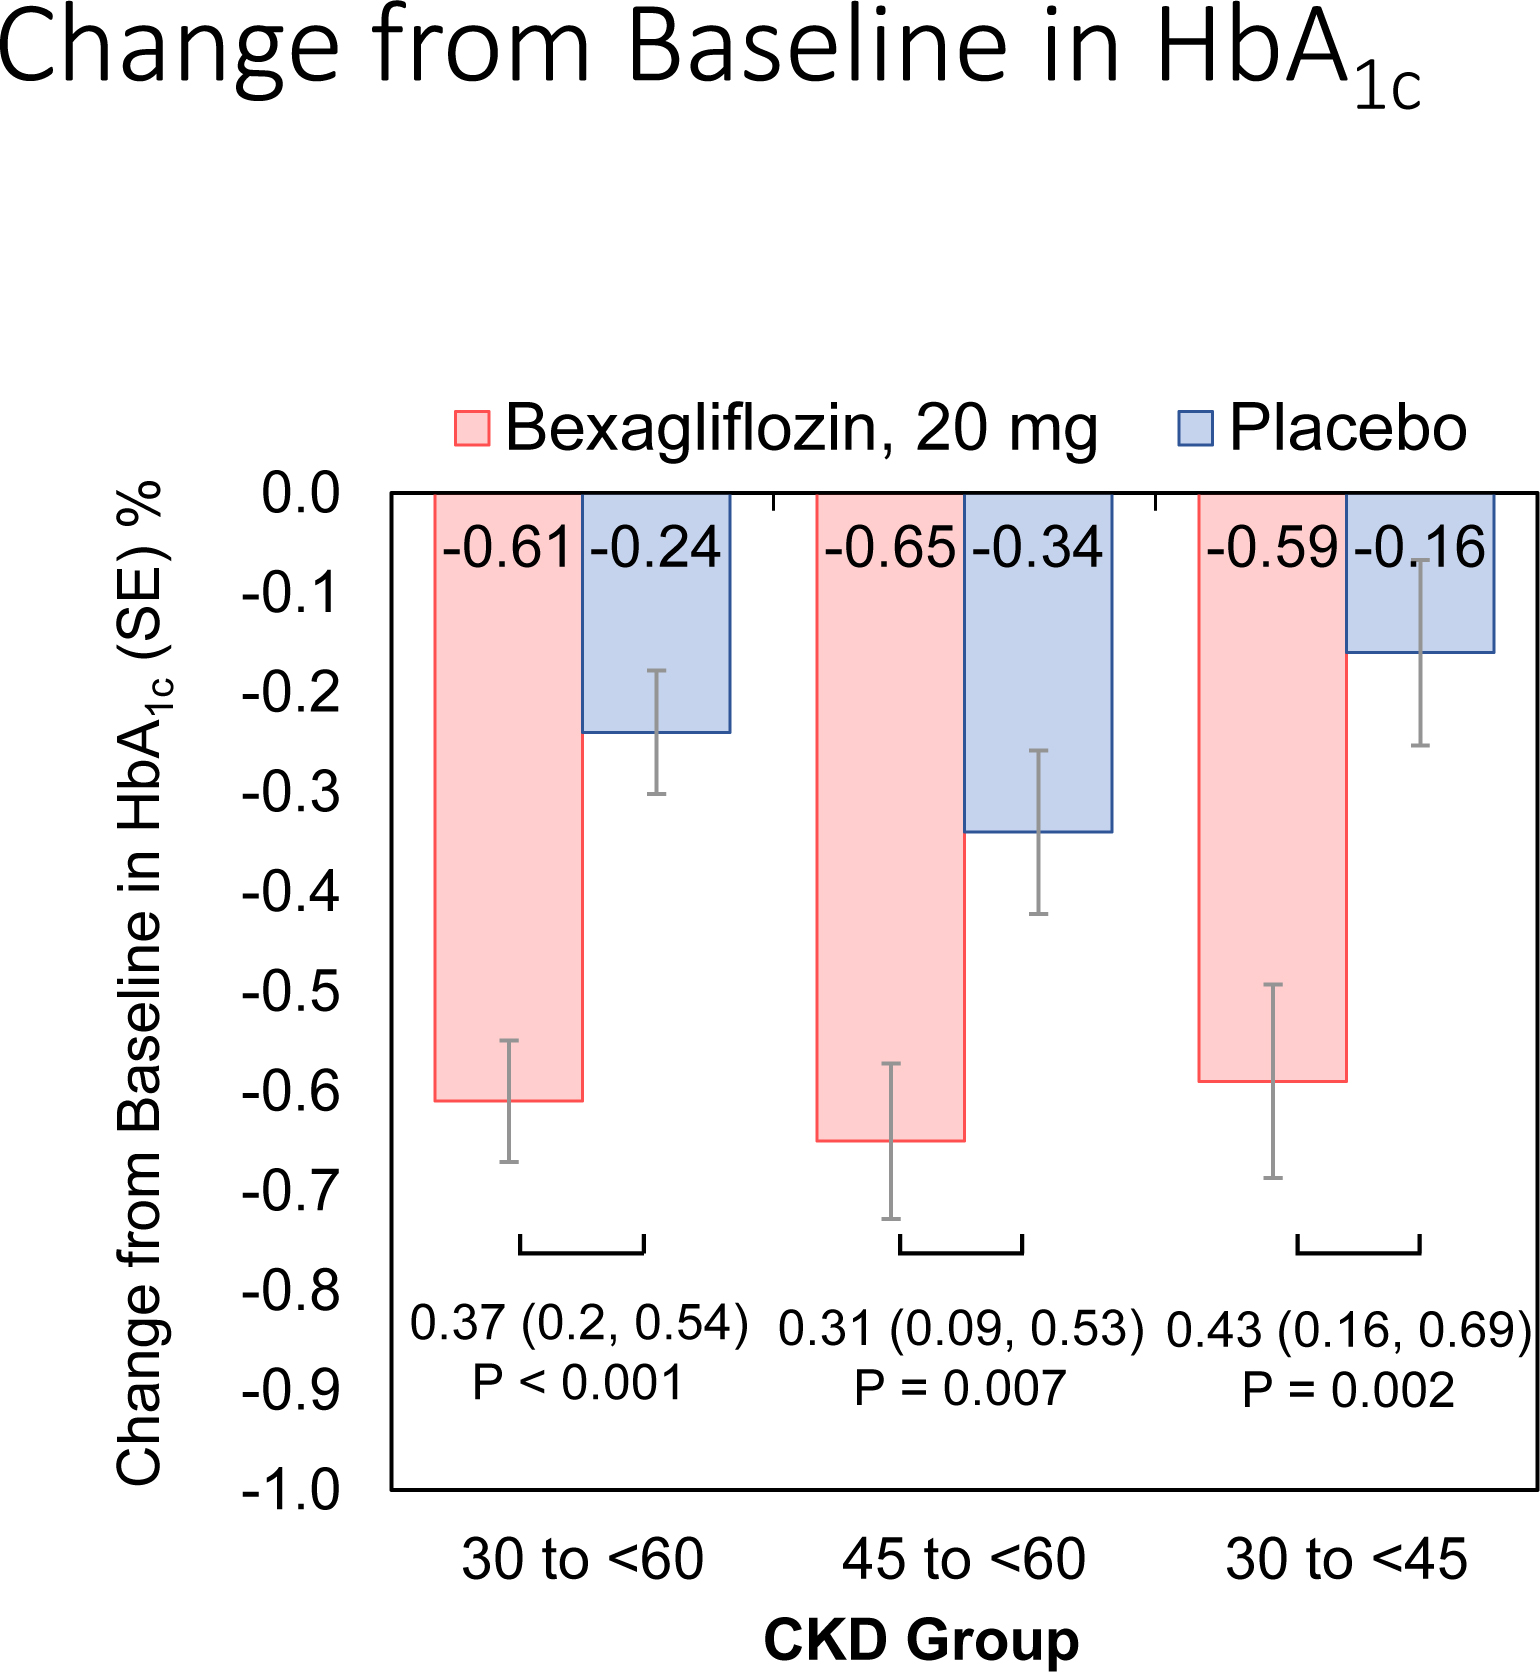
Figure 2:

Estimated mean change from baseline in hemoglobin A1c by treatment and kidney function group at week 24
Key: HbA1c (hemoglobin A1c), SE (standard error), CKD (chronic kidney disease)
The analysis used a mixed-effects repeated measures model that included region, insulin-treated status, baseline eGFR, treatment, visit, treatment-by-visit interaction, and the baseline hemoglobin A1c value as a fixed effect covariate. An unstructured covariance matrix was assumed. Data from Weeks 6, 12, and 24 were used in the model. The last post-baseline observation before rescue medication was carried forward.
