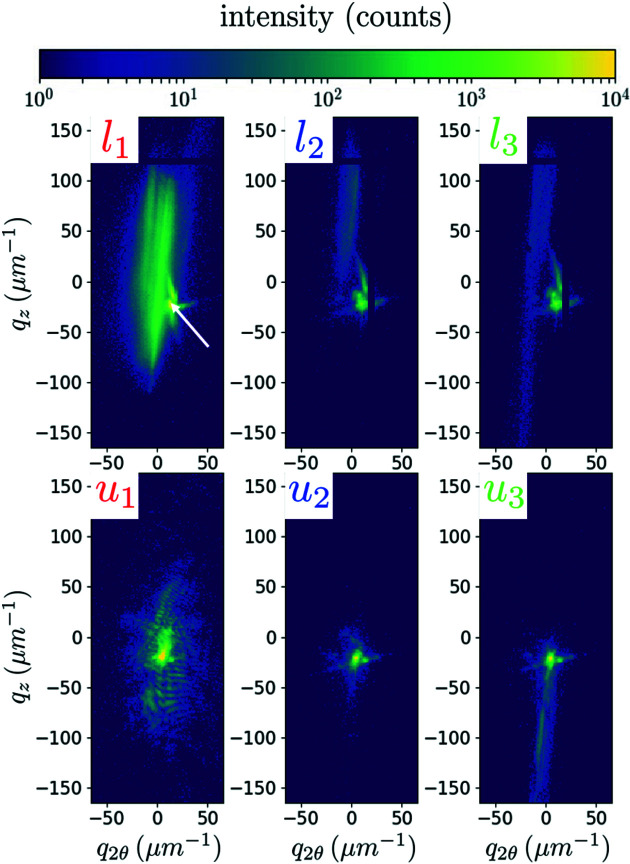
Figure 2.
Collected diffraction patterns with a micro-beam at 8.500 keV on MP3.5, under load (l i ) and after the subsequent retraction (u i ). Three loads are shown: l 1 = 330 MPa, l 2 = 530 MPa and l 3 = 570 MPa. The white arrow on l 1 points to the peak of the pedestal. The coordinates q 2θ and q z correspond to the horizontal and vertical directions on the detector, respectively. The intensity scale is limited to 10 000 photons to reveal the diffuse intensity, but the maximum intensity was actually ∼53 000 photons. The acquisition time was 0.5 s.

