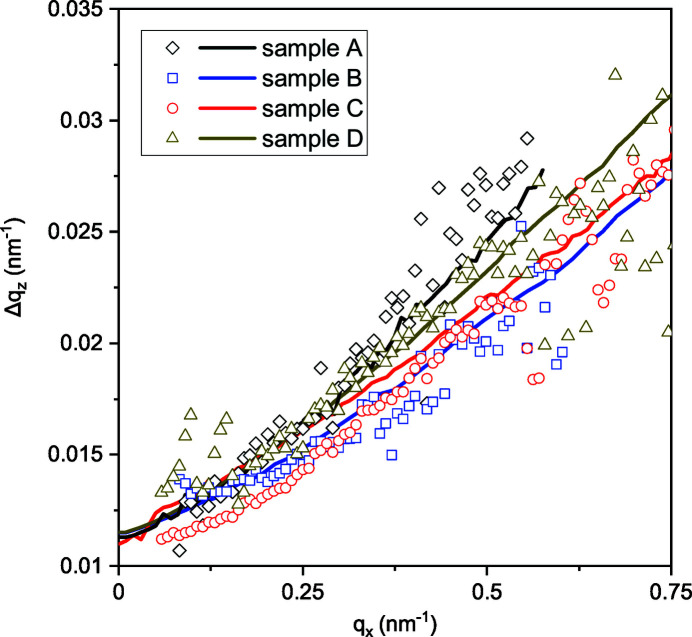
Figure 5.
FWHMs of the intensity profiles Δq z as a function of the wavevector q x (open symbols). Lines are the results of the Monte Carlo simulations, with the ranges of the NW tilt angles presented in Table 1 ▸ and a resolution of 1.2 × 10⁻² nm−1.

