FIGURE 3.

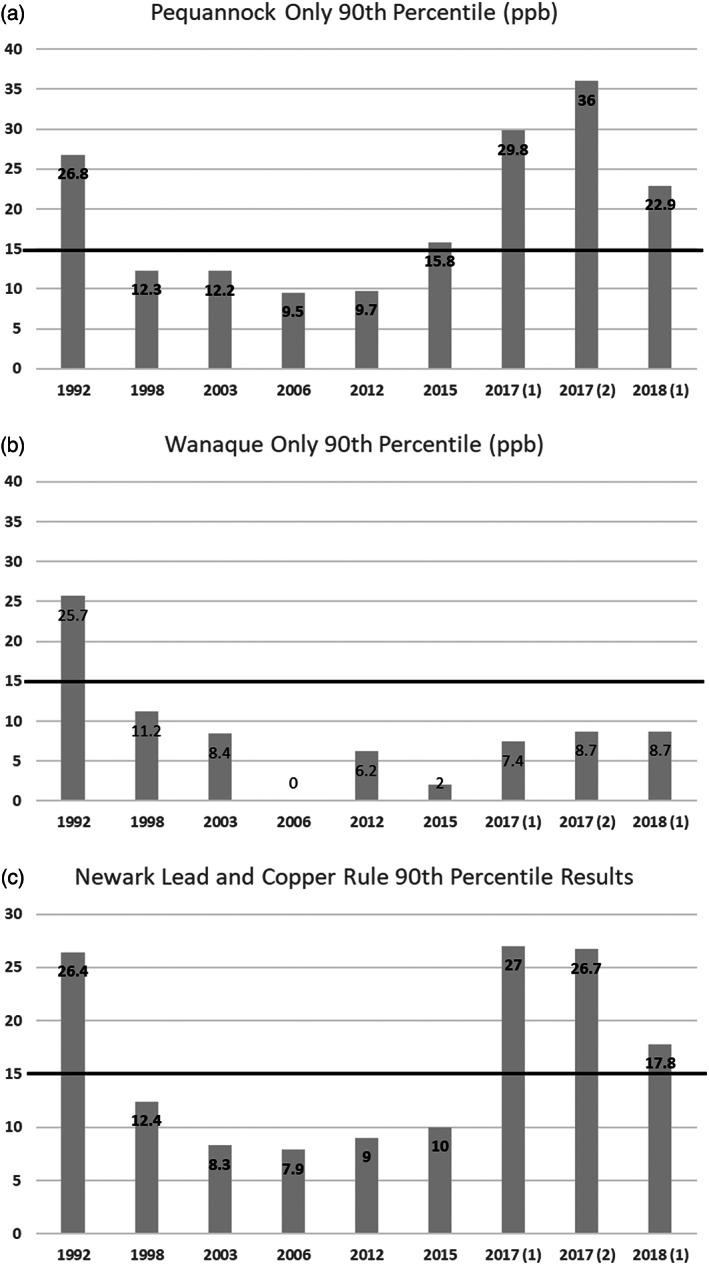
Newark water system LCR compliance sampling data (1992–2018): (a) Pequannock 90th percentile for lead (ppb). (b) Wanaque 90th percentile for lead (ppb). (c) Newark's reported LCR results.

Newark water system LCR compliance sampling data (1992–2018): (a) Pequannock 90th percentile for lead (ppb). (b) Wanaque 90th percentile for lead (ppb). (c) Newark's reported LCR results.