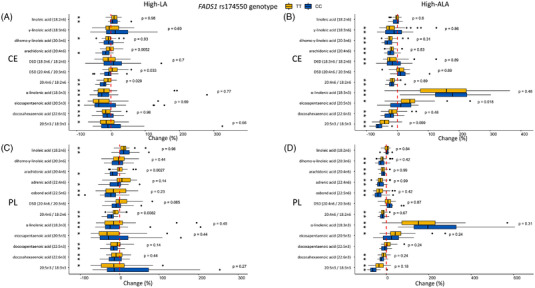
Figure 3.

Changes (%) in PUFA concentrations in plasma cholesteryl esters in the A) high‐LA and B) high‐ALA diets and plasma phospholipids in the C) high‐LA and D) high‐ALA diets. The dotted red line is set to 0% in each graph. Black asterisk (*) shows FDR corrected p‐values <0.05 within the study group changes (0 wk vs 8 wk) and p‐value on the right side the FDR corrected p‐values for genotype–diet interaction.
