
Figure 5.
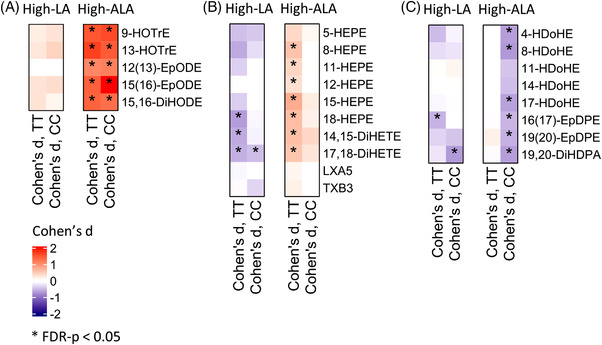
Changes in plasma A) ALA, B) EPA, and C) DHA derived lipid mediator concentrations. Values are Cohen D values (0 wk vs 8 wk) and red and blue colors indicate increased and decreased concentrations, respectively. Black asterisk (*) shows FDR corrected p‐values < 0.05 within the study group changes (0 wk vs 8 wk).