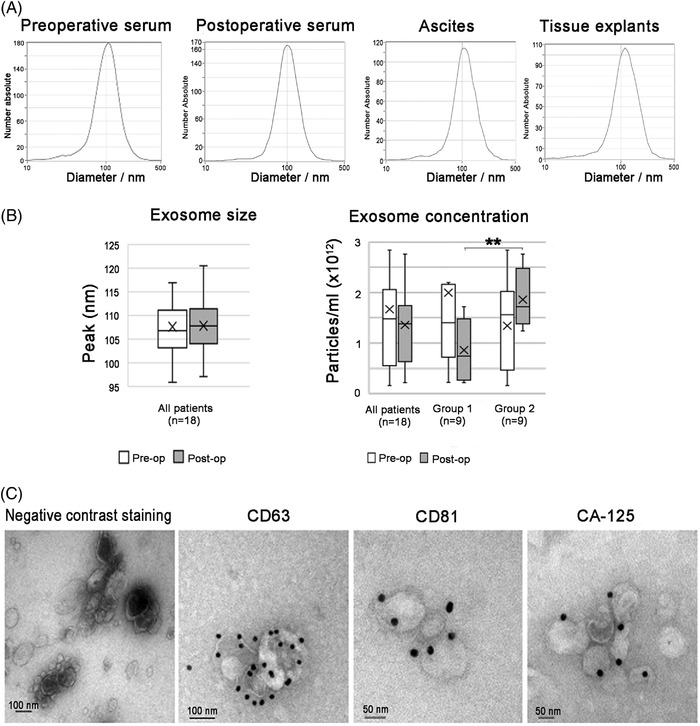
FIGURE 2.

Experiments showing size, morphology and purity of the exosome isolation from serum samples of high‐grade serous ovarian cancer patients. Nanoparticle tracking analysis using ZetaView, illustrating: (A) size distribution of representative samples; (B) median exosome size and concentration and; (C) negative contrast staining and transmission electron microscopy showing exosome morphology and immune electron microscopy of the tetraspanins CD63 and CD81, and the ovarian cancer marker CA‐125. Stars (*p ≤ .05, **p < .01) indicate a significant difference (p = .009) in the postoperative exosome concentration between Group 1 and Group 2.
