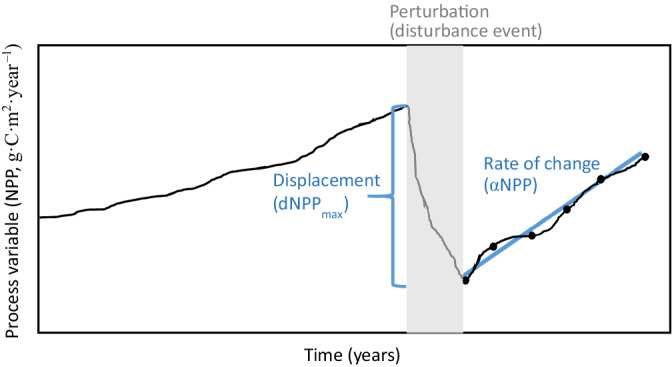
FIGURE 1.

Conceptual model of ecosystem resistance and resilience to perturbation, shown as a function of carbon fixation trajectory (net primary productivity, NPP). Here, we represent the change in pre‐ and post‐disturbance NPP (dNPPmax) as the relative “resistance” to disturbance, where a greater departure of dNPPmax from zero is consistent with lower resistance to change. The y = mx + b slope of post‐disturbance NPP (αNPP) represents the “resilience” to disturbance; a steeper slope is consistent with a more rapid rate of return to pre‐disturbance productivity.
