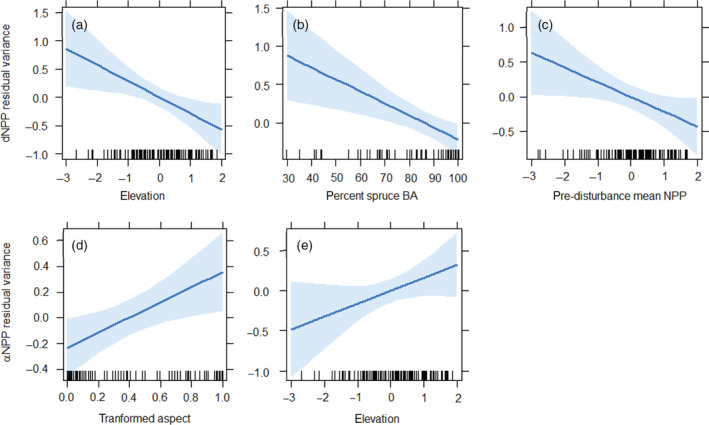
FIGURE 5.

Effects plots showing linear relationships between residual variance in resistance (dNPPmax) and (a) elevation, (b) percent spruce basal area (BA), and (c) pre‐disturbance mean NPP. Effects are also shown for residual variance in resilience (αNPP) for (d) aspect and (e) elevation. Shading represents the 95% confidence interval of modeled effects. Rug plots show distributions of respective independent variables along the x‐axis. NPP, net primary productivity.
