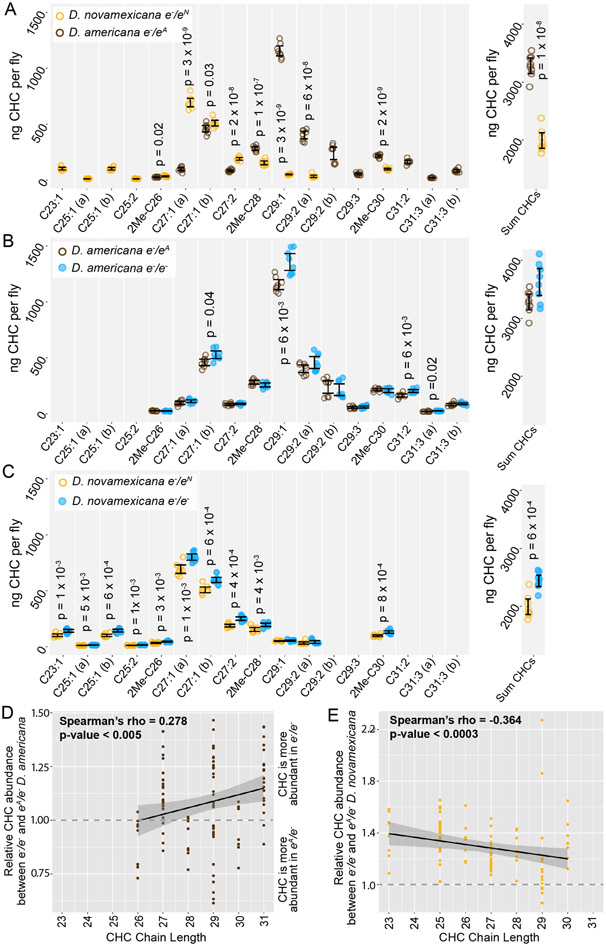
Figure 5. Cuticular hydrocarbons (CHCs) are affected by ebony and differ between D. americana and D. novamexicana.
(A-C) Abundance of individual CHC compounds (ng/fly) and summed CHCs extracted from female flies are plotted for the following genotypes: (A) D. americana and D. novamexicana, each heterozygous for an ebony null (e−) allele, (B) D. americana heterozygous and homozygous for an ebony null allele, (C) D. novamexicana heterozygous and homozygous for an ebony null allele. Eight biological replicates are shown for each genotype, with error bars representing 95% confidence intervals. For each comparison, the p-value from a Welch’s t-test with a Benjamini-Hochberg multiple test correction (alpha = 0.05) is shown when a significant difference in abundance was detected for a CHC present in both genotypes being compared. CHCs are shown from left to right with increasing chain length (represented by “C” followed by the chain length) with double-bond and methyl-branched structures indicated by notations after the colon or before the “C”, respectively. For example, C25:1 represents a 25-carbon monoene, C25:2 represents a 25-carbon diene, and 2Me-C28 represents a 28-carbon alkene with a methyl branch at the second carbon. (D-E) Abundance of each CHC in ebony null mutants relative to flies heterozygous for the ebony null allele is plotted by carbon chain length for (D) D. americana and (E) D. novamexicana. Black trendlines in panels D-E show linear regressions, with shaded areas representing the standard error and both Spearman’s rho and p-values indicated on each plot.

