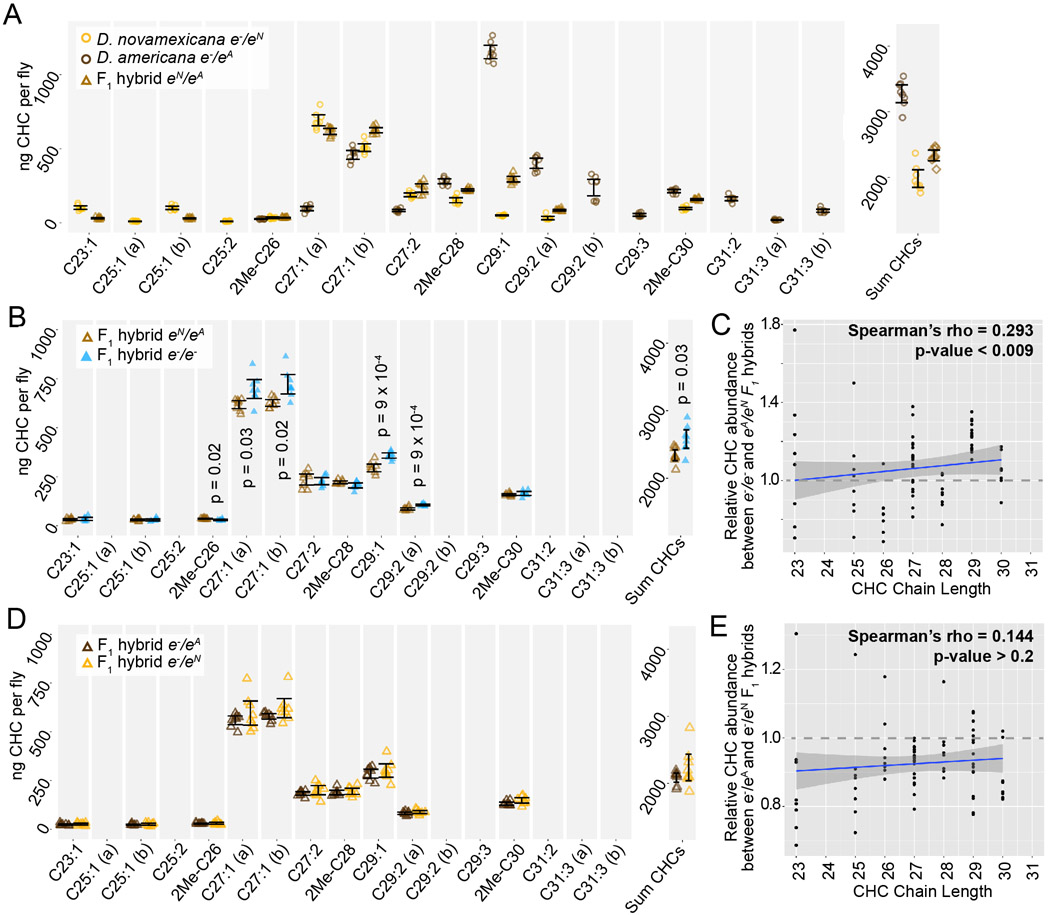
Figure 6. ebony does not contribute to divergence of CHCs between D. americana and D. novamexicana.
(A) Abundance of individual CHC compounds (ng/fly) and summed CHCs extracted from female flies are plotted for D. americana and D. novamexicana ebony heterozygotes as well as F1 hybrids heterozygous for wild-type alleles of ebony. (B-C) CHCs from F1 hybrids homozygous for ebony null alleles are compared to CHCs from F1 hybrids with wild-type D. americana and D. novamexicana ebony alleles, showing the absolute abundance of individual and summed CHC compounds (B) as well as the relative abundance of CHCs by carbon chain length (C). In panel B, p-values are shown from a Welch’s t-test with a Benjamini-Hochberg multiple test correction (alpha = 0.05) when a significant difference in abundance was detected for a CHC present in both genotypes. (D-E) CHC profiles are plotted for reciprocal F1 hybrids that differ only by which wild-type ebony allele they carry, either D. americana (eA) or D. novamexicana (eN), with absolute abundance of individual and summed CHCs shown in (D) and relative abundance of CHCs by chain length shown in (E). No p-values are shown in (D) because no CHCs showed a statistically significant difference in abundance between the two F1 hybrid genotypes from the reciprocal hemizygosity test (Welch’s t-test with Benjamini-Hochberg multiple test correction, p>0.05 for each CHC). In panels C and E, blue trendlines show linear regressions, with shaded areas representing the standard error and both Spearman’s rho and p-values indicated on each plot. In all panels, data from eight replicate flies is shown for each genotype.

