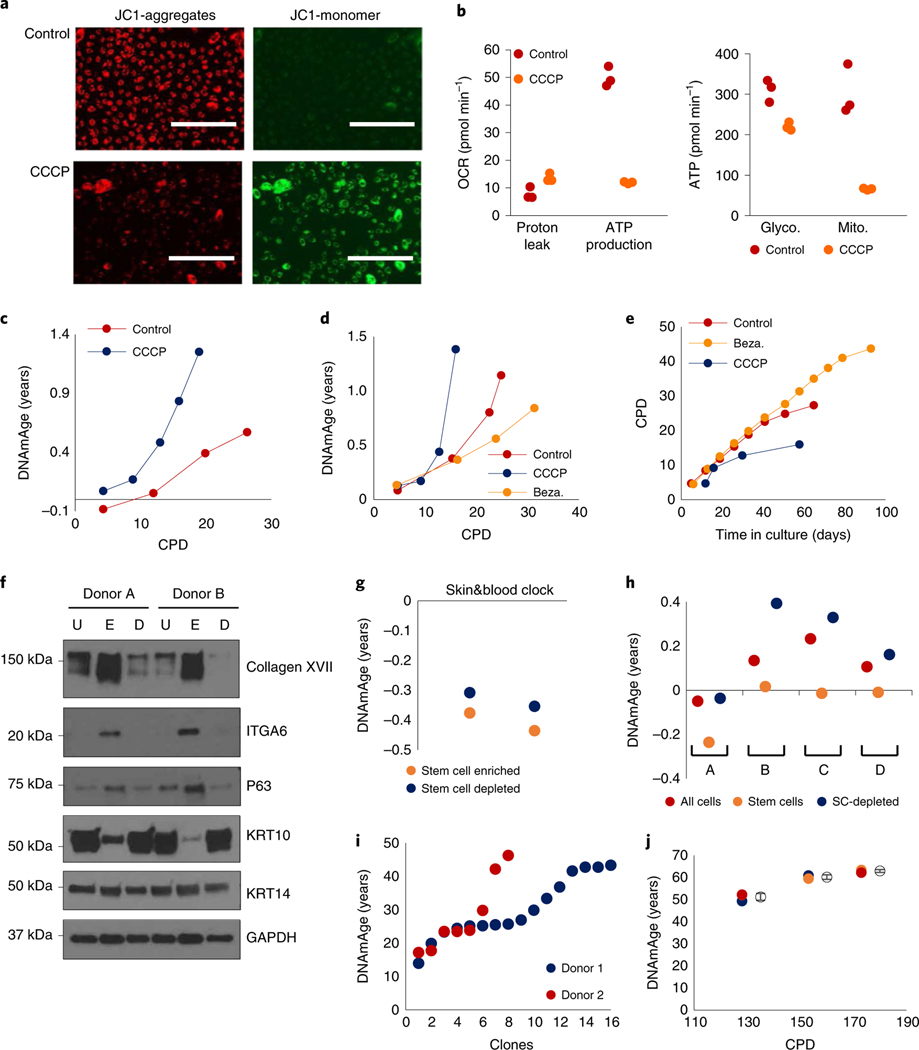
Fig. 3 |. Mitochondrial activity and tissue composition affects EpiAge.
a, Mitochondrial potential of untreated and CCCP-treated neonatal HDKs compared using JC-1, which aggregates in mitochondria with high potential (red) but remains green when unaggregated Scale bars, 200 μm. Representative of two experiments. b, Production of adenosine triphosphate (ATP) and mitochondrial proton leak of control and CCCP-treated HDKs were measured with Seahorse technology (left). Comparative ATP production from glycolysis or the Krebs cycle was also measured (right). Data represent triplicates of a single experiment, which was repeated twice. OCR, oxygen consumption rate. c, Determination of the effect of CCCP on cellular epigenetic aging. Representative of a single experiment. d, Effects of CCCP and bezafibrate (Beza.) on epigenetic aging of neonatal HDK (representative of two experiments). e, Lifespan of HDKs (representative of a single experiment). Representative figure of two experiments. f, Expression of various proteins in unprocessed epidermis (U), stem cell-enriched fraction (E) and stem cell-depleted fraction (D) from two neonatal donors. Representative of four blots. g, EpiAge of stem cell-enriched fraction (stem cells) and stem cell-depleted fraction (SC-depleted) in epidermis from two donors. Representative of a single experiment. h, EpiAges of in vitro-cultured unfractionated cells (all cells), stem cell-enriched fraction (stem cells) and stem cell-depleted fraction (SC-depleted) from four neonatal donors, A to D. Representative of a single experiment. i, EpiAge of individual clones derived from two independent HCAEC donors with an EpiAge of 23 years. j, EpiAge of HUVECs from three different CPDs was measured in triplicate. Empty circles represent mean EpiAge of the replicates, and error bars represent standard deviation. Representative of a single experiment

