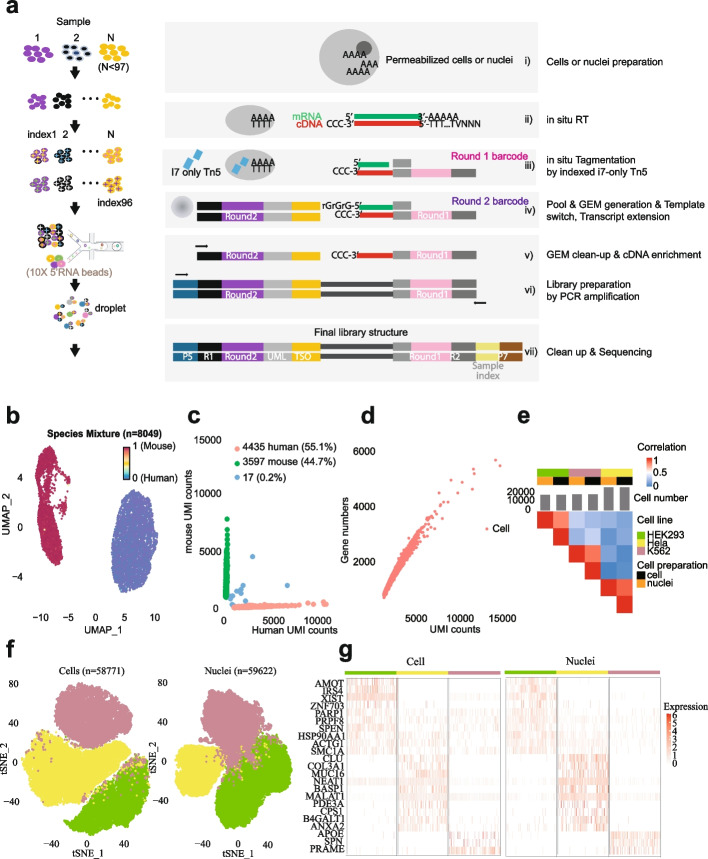
Fig. 1.
Overview and validation of FIPRESCI. a The FIPRESCI schematic workflow and detailed method design. Permeabilized cells or nuclei are reverse transcribed, then nuclei or cells are randomly distributed into wells containing indexed Tn5 transposome to label the cellular origin of RNA/cDNA hybrid heteroduplexes within cells. The cells or nuclei containing preindexed cDNA are pooled, randomly mixed, and encapsulated using a commercial microfluidic platform and amplified for preparation of the sequencing library. b Species-mixing experiment with a library prepared from the 1:1 mix of human (Jurkat) and mouse (NIH-3T3) permeabilized cells. Human uniquely barcoded cells (UBCs) are blue, mouse UBCs are red in UMAP. n = 8049 cells. c The number of unique fragments aligning to the human or mouse genome. Human UBCs are red, mouse UBCs are green, and mixed-species UBCs are blue. The estimated barcode collision rate is 0.2%, whereas species purity is > 99%. d The number of UMI counts plotted against detected genes from species-mixing experiments. e Heatmap showing pairwise correlations and hierarchical clustering for the gene expression profiles across cell lines, cell preparation methods using FIPRESCI. f Dimensionality reduction (UMAP) and unsupervised clustering for single-cell (n = 58,771) and single-nucleus (n = 59,622) FIPRESCI of the three cell lines. HEK293 is red, Hela is green, and K562 is blue. g Heatmap showing differentially expressed genes and gene expression levels of single-cell and single-nucleus FIPRESCI for three cell lines. Each column represents a single cell

