FIGURE 4.

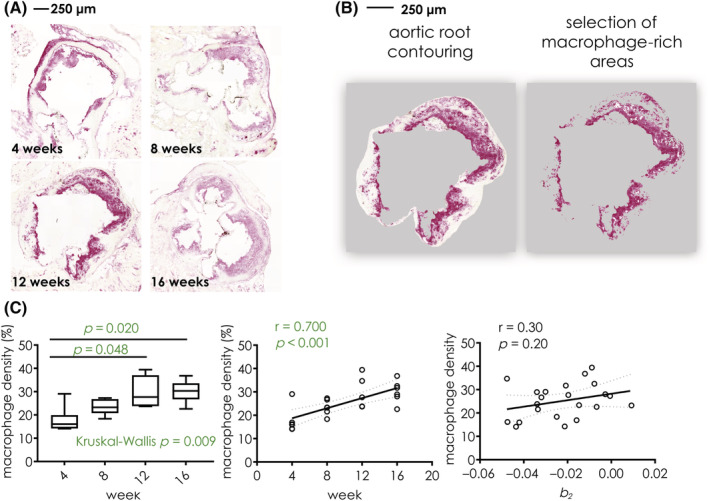
(A) Representative CD68 staining of aortic root of mice at 4 (top left), 8 (top right), 12 (bottom left), and 16 (bottom right) weeks on a high‐fat diet. (B) Quantification of the macrophage percentage area: the inner and outer contours of the aortic root are delineated (left panel); macrophage‐rich areas are then selected using a semiautomated threshold (right panel); macrophage density is calculated as the ratio between macrophage‐rich areas and the whole vessel wall area and is expressed as a percentage (%). (C) Boxplot (left) and linear regression plot (middle) of macrophage density in mice 4, 8, 12, and 16 weeks on a high‐fat diet; the right panel shows a linear regression plot of macrophage density for each animal against the parameter b 2 from dynamic contrast‐enhanced magnetic resonance imaging. Midlines in boxplots represent the median, while whiskers represent the minimum and maximum datapoints
