Figure 1.

Meta-analysis workflow and study heterogeneity.
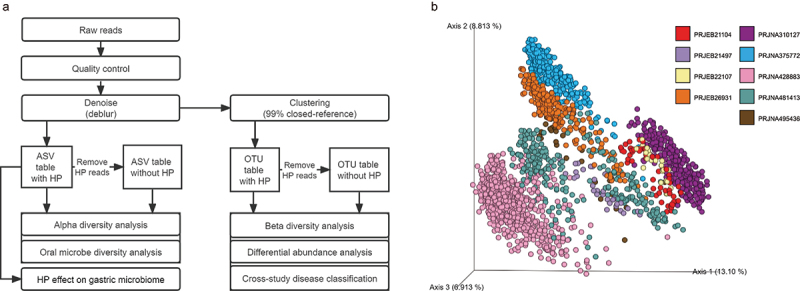
(a) Overview of bioinformatic workflow for this meta-analysis. (b) The PCoA plot is based on unweighted UniFrac distance showing profound variations among different studies.

Meta-analysis workflow and study heterogeneity.
(a) Overview of bioinformatic workflow for this meta-analysis. (b) The PCoA plot is based on unweighted UniFrac distance showing profound variations among different studies.