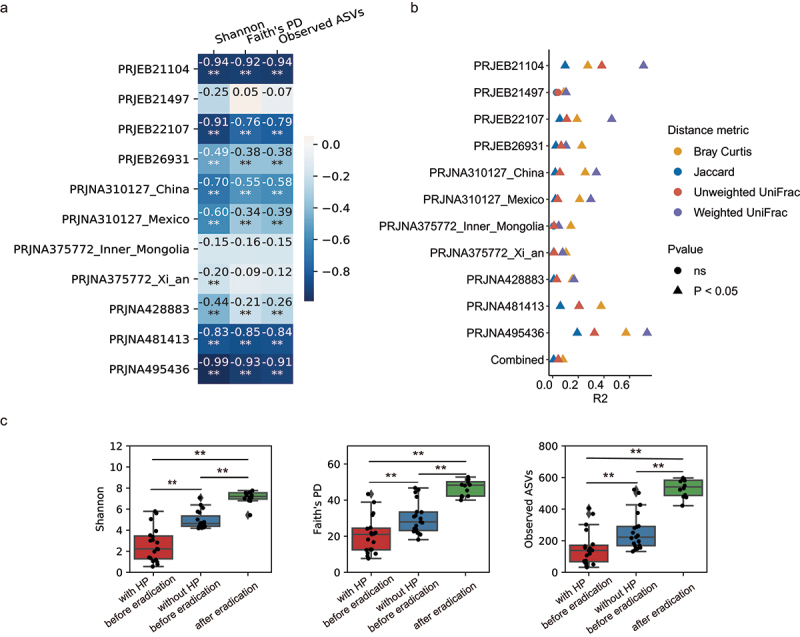
Figure 2.

The effect of H. pylori on the gastric microbiome.
(a) Heatmap showing the correlations between the relative abundance of HP and Shannon, Faith’s PD and Observed ASVs in each cohort. The colors in the heatmap were proportional to the Spearman’s correlation coefficient displayed in each cell. **P < 0.01, *0.01 < P < 0.05. (b) Microbial variations explained by the relative abundance of HP in each cohort. R2 was calculated using the ADONIS test. (c) Alpha diversity in patients before and after receiving HP eradication in dataset PRJNA495436 with or without HP reads removed. Statistical significance was determined by t-test: **P < 0.01, *0.01 < P < 0.05.
