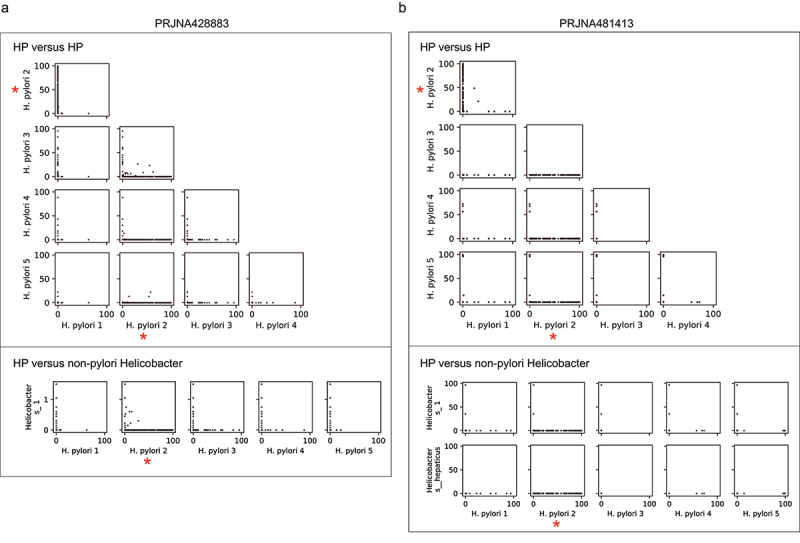
Figure 3.

Mutual exclusivity of Helicobacter ASVs.
(a–b) Scatter plots show the relative abundance of each pair of Helicobacter ASVs in dataset PRJNA428883 (a) and dataset PRJNA481413 (b). Each dot is one gastric microbiome sample. The top panel shows the relationship between every two HP ASVs; the bottom panel shows the relationship between each HP ASV and non-pylori Helicobacter ASV. The most dominant HP ASV in the population was marked by a red star.
