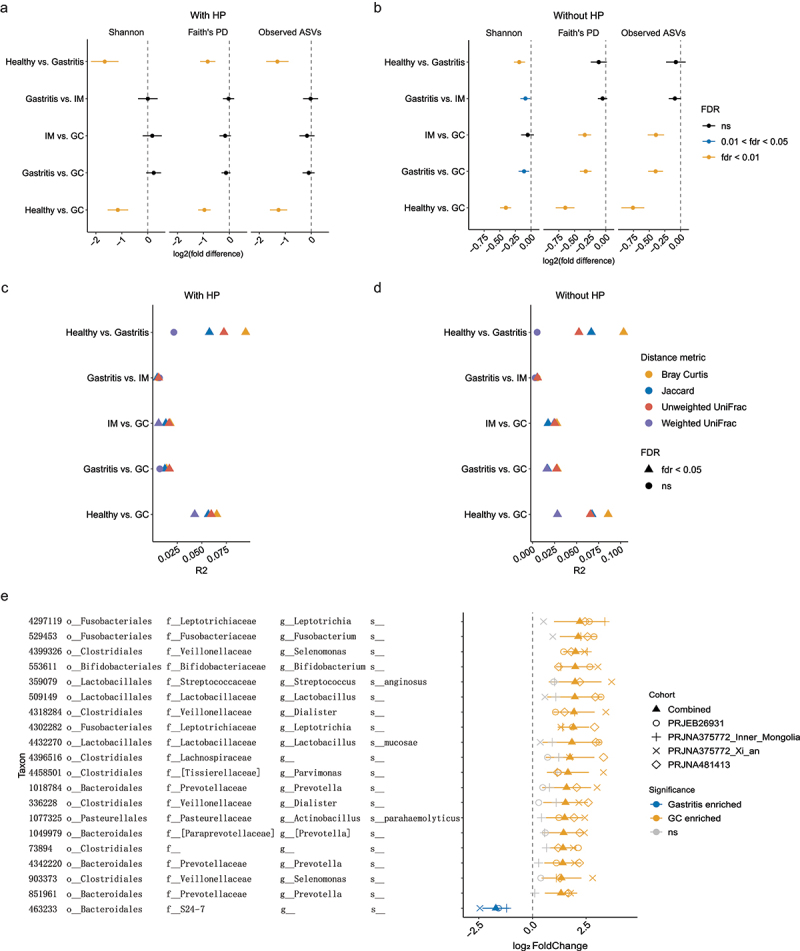
Figure 4.

Mucosal microbiome shifted as gastric diseases progress.
(a-b) Forest plots of alpha diversity between each two stages. The combined log2(fold difference) and FDR-corrected p-values calculated by REM were shown in the figure. Point to the left of the gray dashed line indicates higher diversity in the early stage; point to the right of the gray dashed line represents higher diversity in the advanced disease stage. The length of the error bar depicts the 95% CIs. Analyses were performed both with (a) and without HP reads (b). (c-d) ADONIS based on various distance metrics demonstrated significant differences in the gastric microbiome composition between each of the two stages. Combined R2 across different cohorts was calculated using the ADONIS test with cohort as stratum. Analyses were performed both with (c) and without HP reads (d). (e) Combined log2(fold change) for the 20 differential OTUs with the largest effect size between gastritis and GC, calculated using DESeq2 and REM.
