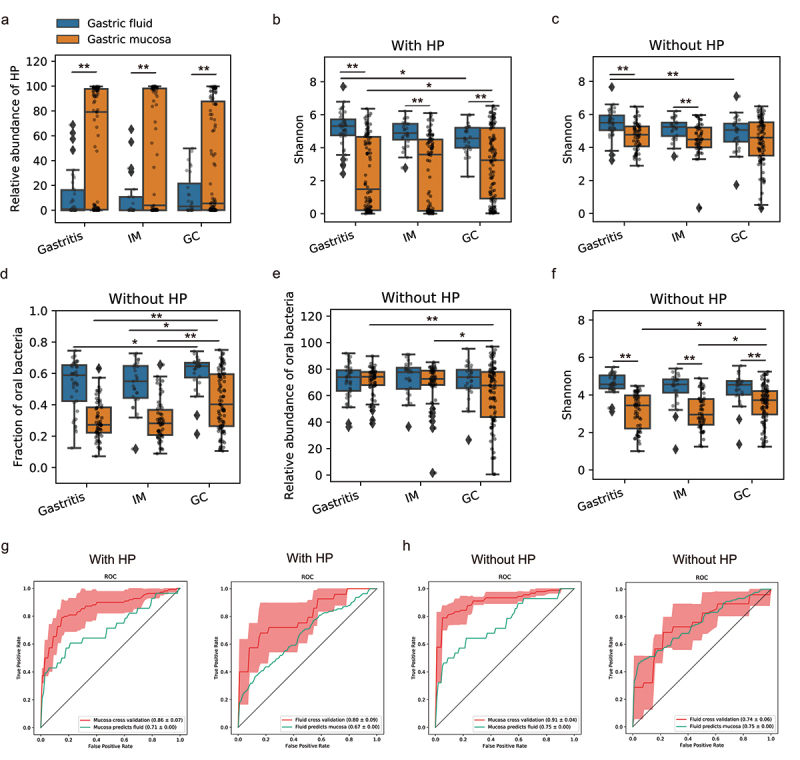
Figure 6.

Dysbiosis of the gastric fluid and mucosal microbiome across GC stages in dataset PRJNA481413.
(a) The relative abundance of HP in fluid and mucosal samples across different stages. (b-c) Shannon index of gastric microbiome in fluid and mucosa samples across different stages. Analyses were performed both with (b) and without HP sequences (c). (d-f) The fraction (d), relative abundance (e), and alpha diversity (f) of oral bacteria in gastric fluid and mucosal samples across three disease stages. Analyses were performed without HP reads. **P<0.01, *0.01 < P<0.05. (g) The RF model trained on mucosal microbiome could distinguish GC from non-GC samples with an average AUC of 0.86, and it could predict fluid samples with an AUC of 0.71. The RF model trained on the fluid microbiome achieved a cross-validation AUC of 0.80, and it could classify mucosal samples with an AUC of 0.67. (h) After removing HP sequences from the analyses, the RF model trained on mucosal microbiome achieved a cross-validation AUC of 0.91 and it could predict fluid samples well with an AUC of 0.75. The RF model trained on fluid microbiome achieved a cross-validation AUC of 0.74 and it could predict mucosal samples well with an AUC of 0.75.
