
Figure 3.
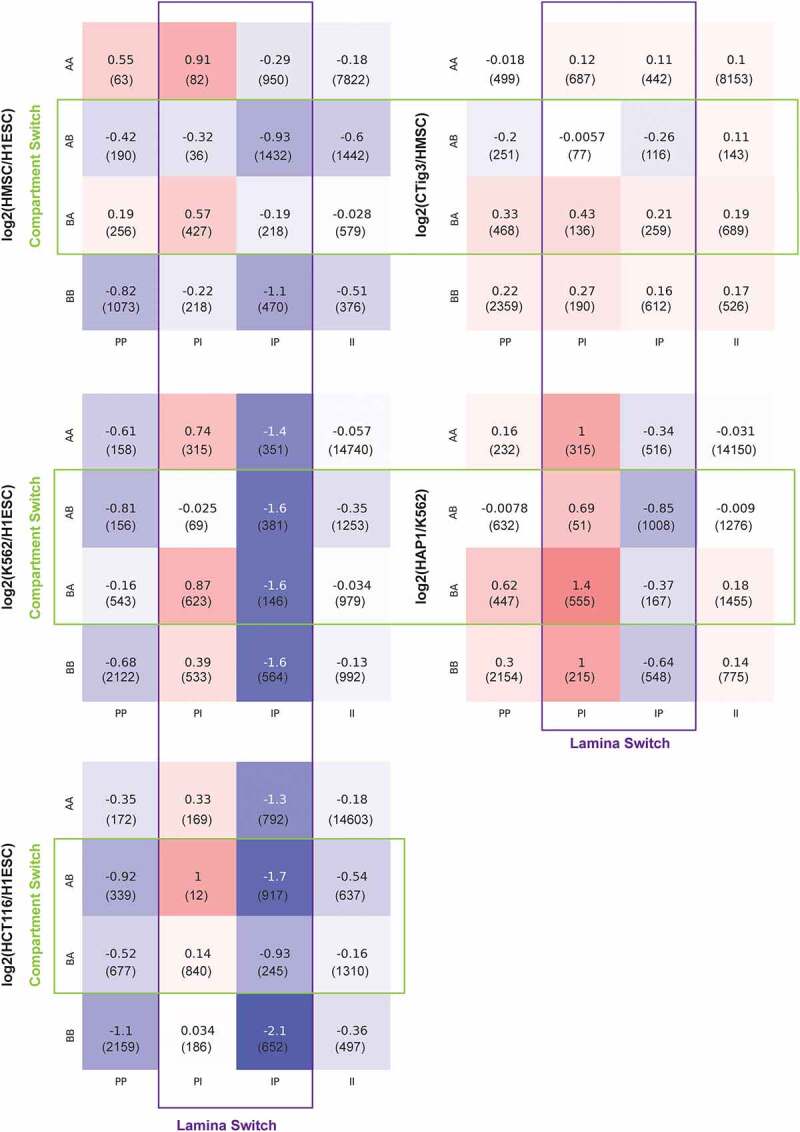
Mean gene expression change for different categories of genomic regions based on compartment identity and lamina association changes. Color shading corresponds to mean gene expression log2 fold change as indicated by the numbers in each box. Numbers in parentheses indicate how many genes fall into each category. Acronyms AB and PI are as defined in Figure 2. Cell type comparisons are indicated to the left of each panel. Green box highlights comparisons where regions switch compartments between cell types while purple box highlights regions that change lamina status.