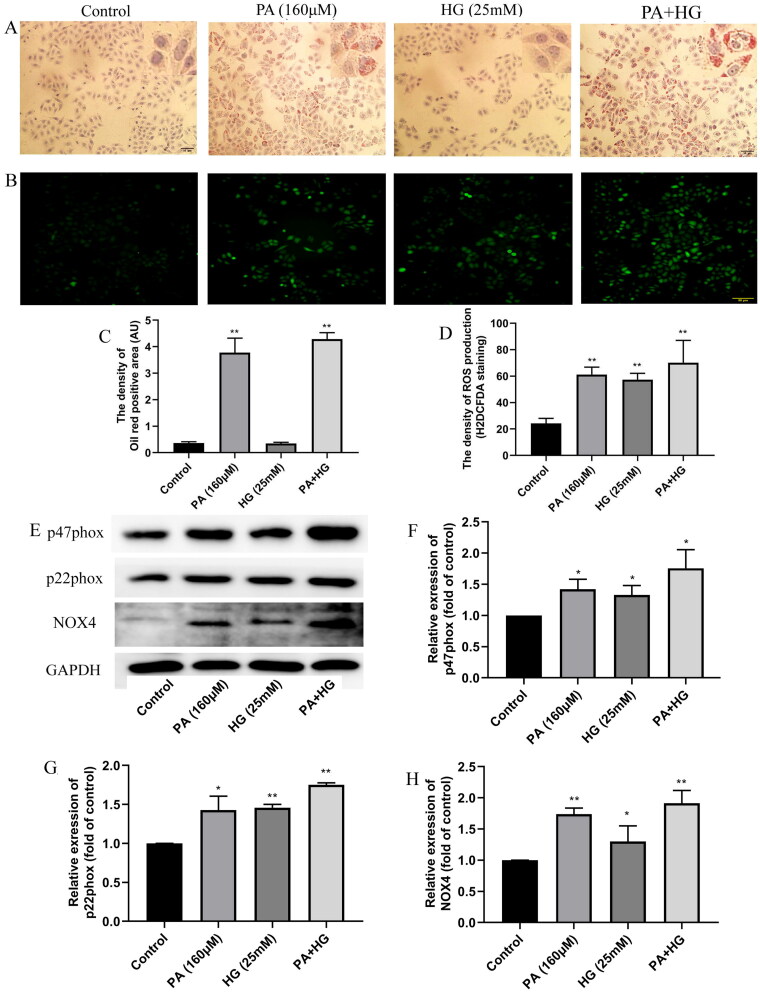
Figure 6.
Effects of PA and PA + HG on lipid deposition and oxidative stress in the HMCs. (A) The results of lipid deposition in the HMCs (Oil Red O staining, ×200). (B) The ROS production of HMCs (H2DCFDA, ×200). (C) The mean density of Oil Red O staining in the HMCs. (D) The mean density of ROS production in the HMCs. (E) The bands of p47phox, p22phox, NOX4, and GAPDH (Western blotting). (F) The relative expression of p47phox over control. (G) The relative expression of p22phox over control. (H) The relative expression of NOX4 over control. The data are expressed as the mean ± SD, n = 3, *p< 0.05, **p< 0.01 compared with the control group.

