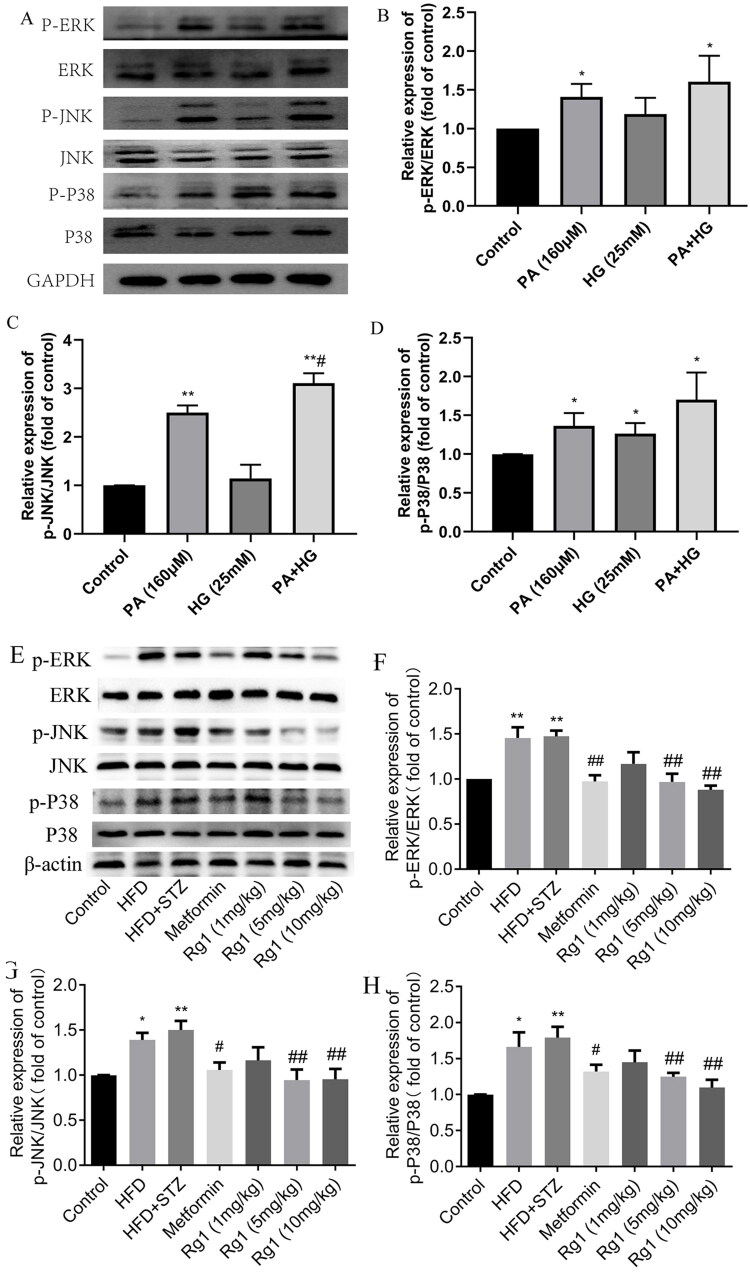
Figure 8.
Effects of PA and PA + HG on MAPK pathway in the HMCs and the regulatory role of Rg1 in the T2DM mice. (A) The bands of p-JNK, JNK, p-P38, P38, p-ERK, ERK, and GAPDH in the HMCs (Western blotting, n = 3). (B) The relative expression of p-ERK/ERK in the HMCs over control. (C) The relative expression of p-JNK/JNK in the HMCs over control. (D) The relative expression of p-P38/P38 in the HMCs over control. (E) The bands of p-JNK, JNK, p-P38, P38, p-ERK, ERK, and β-actin in the mice (Western blotting, n = 4). (F) The relative expression of p-ERK/ERK over control. (G) The relative expression of p-JNK/JNK over control. (H) The relative expression of p-P38/P38 over control. The data are expressed as the mean ± SD, *p< 0.05, **p< 0.01 compared with the control group; #p< 0.05, ##p< 0.01 compared with the HFD + STZ group.

